data-driven design
branding
site design
Bringing the American Revolution to life through maps
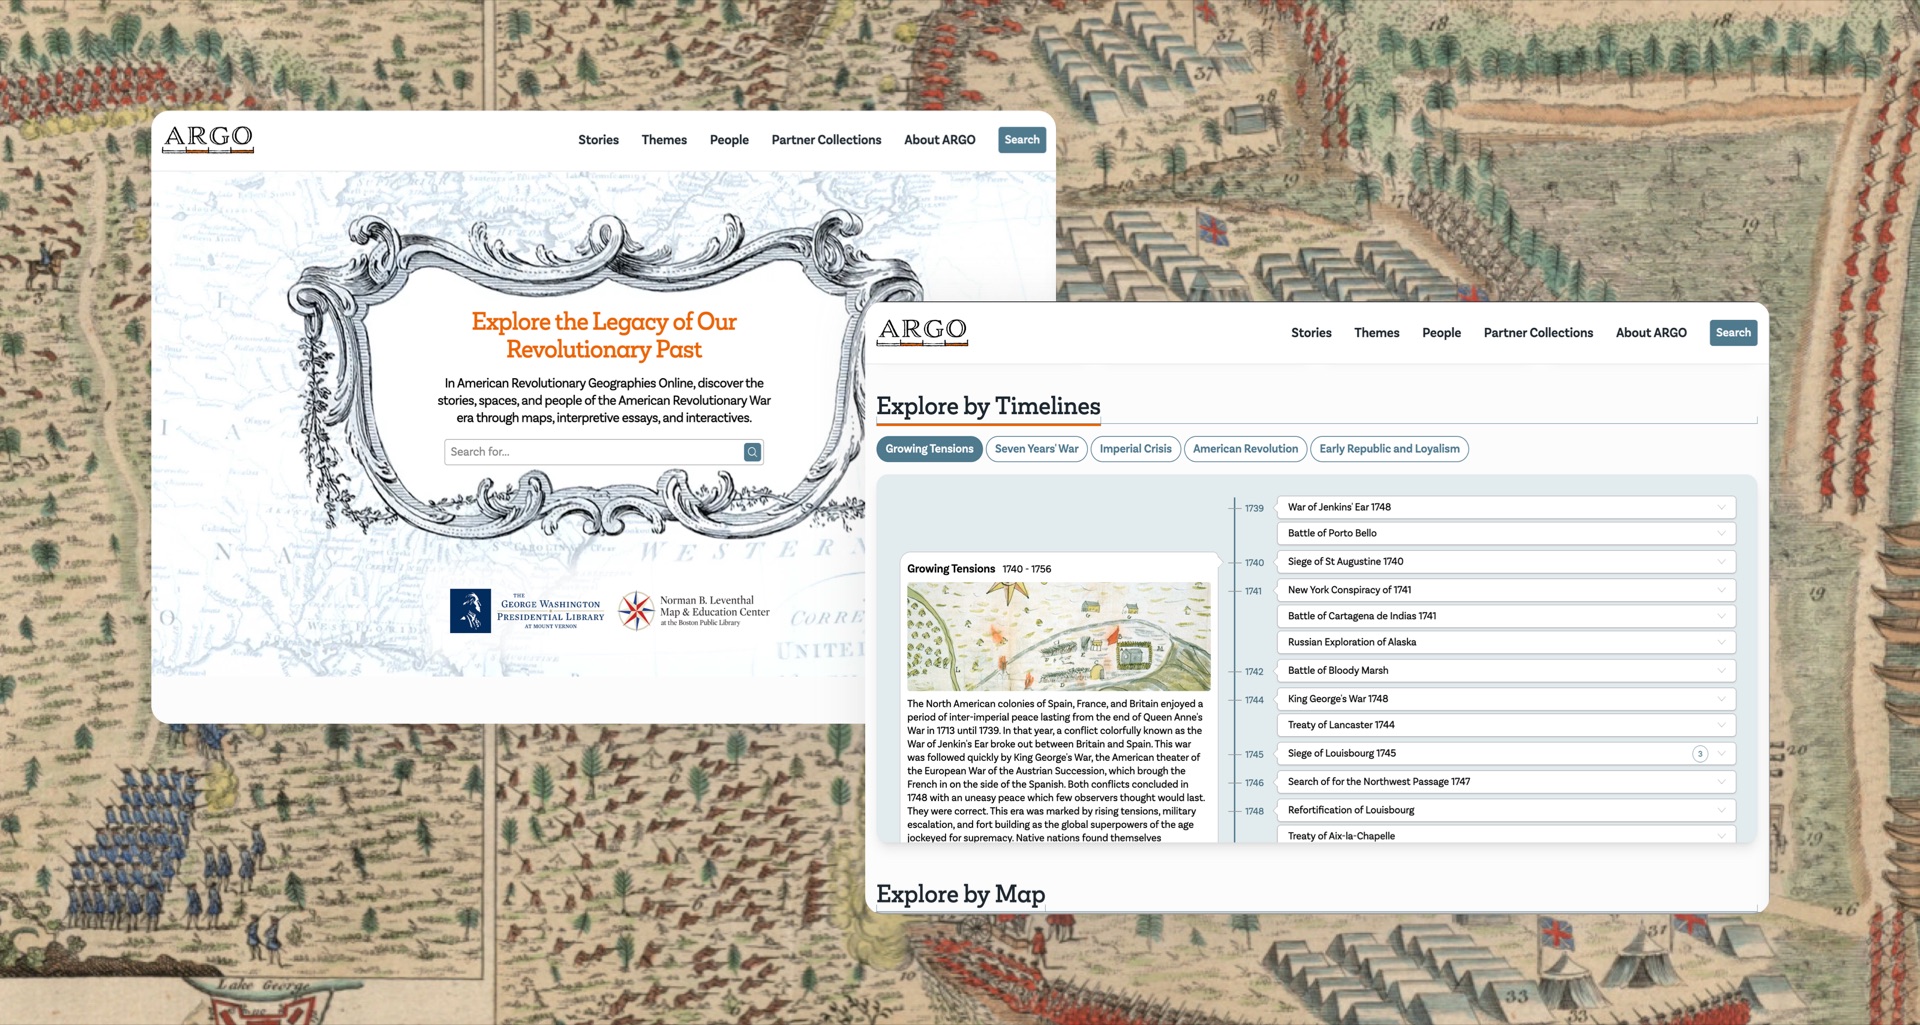
Academics, reseachers, and the public have an all-new, interactive way to experience a collection of over 900 maps of North America made between 1750 and 1800 through ARGO Maps. To celebrate the United States' 250th anniversary and Mount Vernon’s growing map collection, George Washington’s Mount Vernon and Boston Public Library’s Leventhal Map Center envisioned a curated website that would tell the story of the American Revolution through maps.
Discovery Phase
A project like this requires a deep dive into audiences to design a site that fulfills are user needs. Based on audience understanding, three primary categories for their goals:
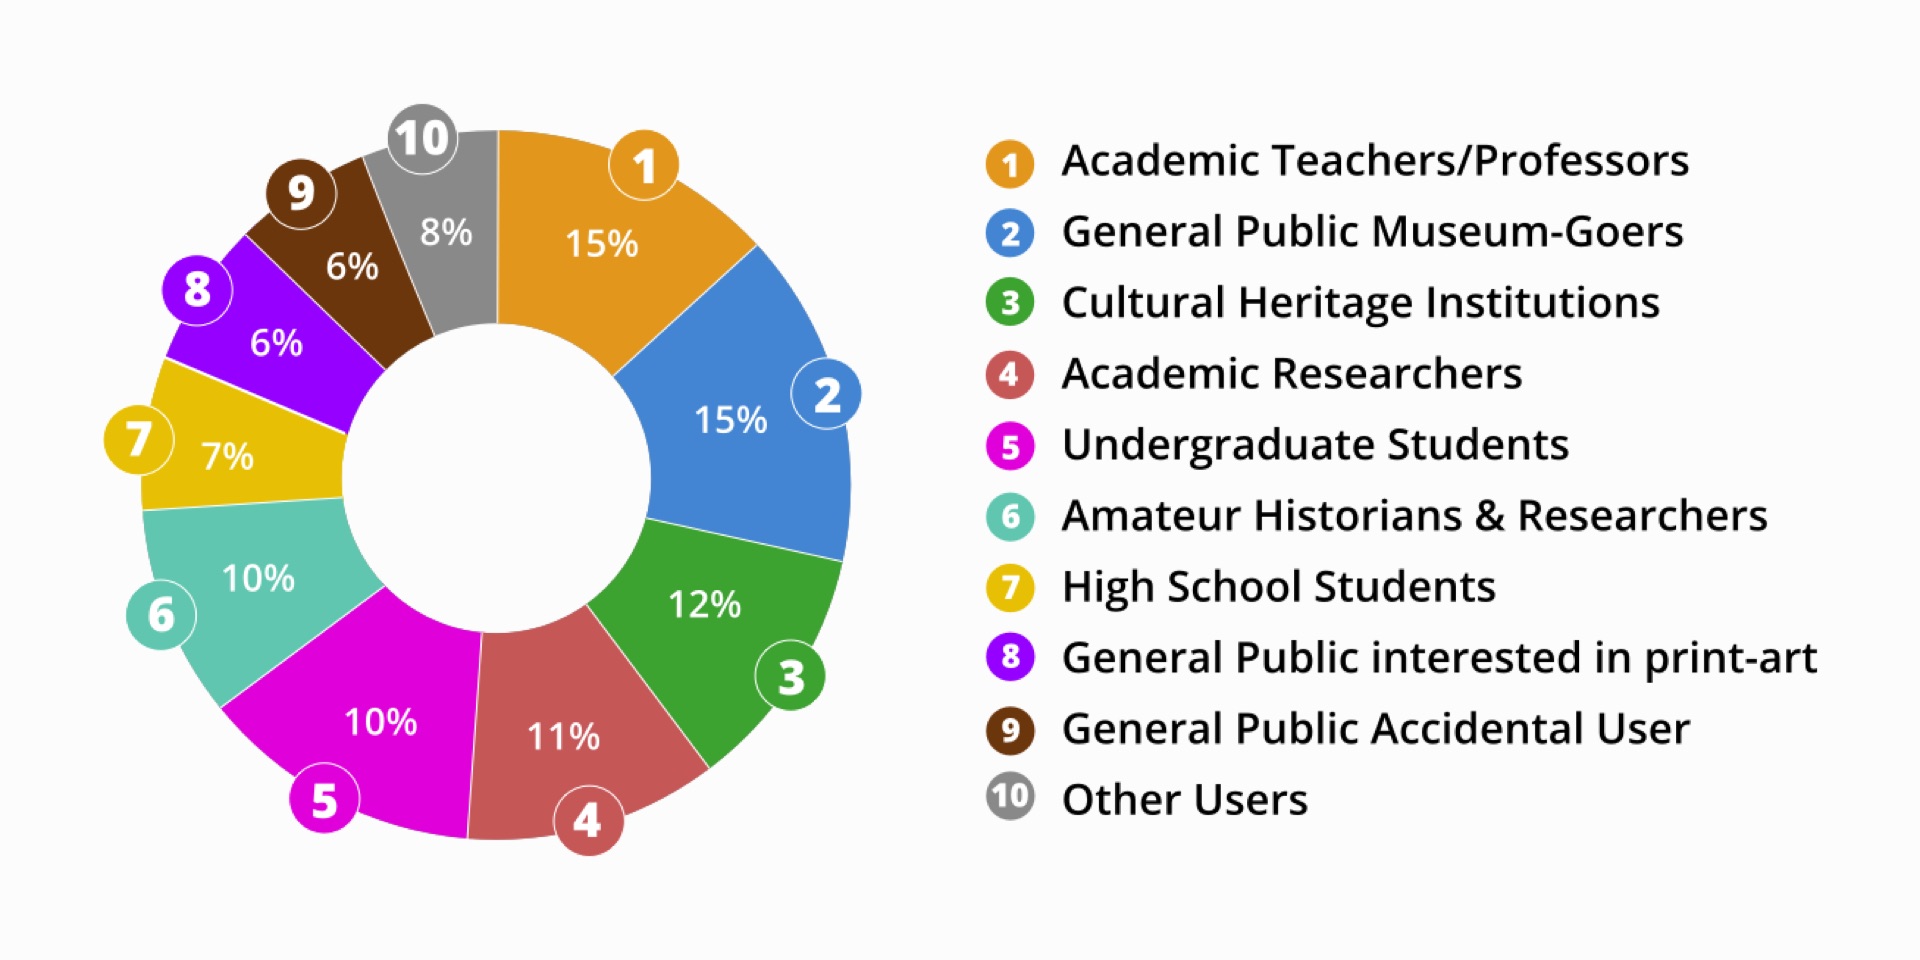
Visual discovery
People wanted to explore maps through compelling and intuitive interfaces.
Interest-specific exploration
Topics such as map materials, creators, geographic areas, and historical themes were critical points of engagement.
Practical use
People needed access to material for research, teaching and personal projects.
These insights shaped the design, ensuring multiple pathways to explore the collection--whether people wanted to dive deep or explore casually.
Asking Questions & Exploring the Data
At the start of this project, there were a lot of questions about the American Revolution itself:
1. When was the last time any of us studied it outside of primary school?
2. What were the key events that took place?
3. Where exactly did it take place and who all were involved?
4. When did it start and how long did it last?
And it was clear our team wouldn't be the only ones with these questions. We discovered in our own confusion that the interface and content needed to help people get a sense of what the Revolution was, and at the same time not get in the way of the researchers and academics who needed specific answers quickly and easily.
Defining Pathways of Exploration
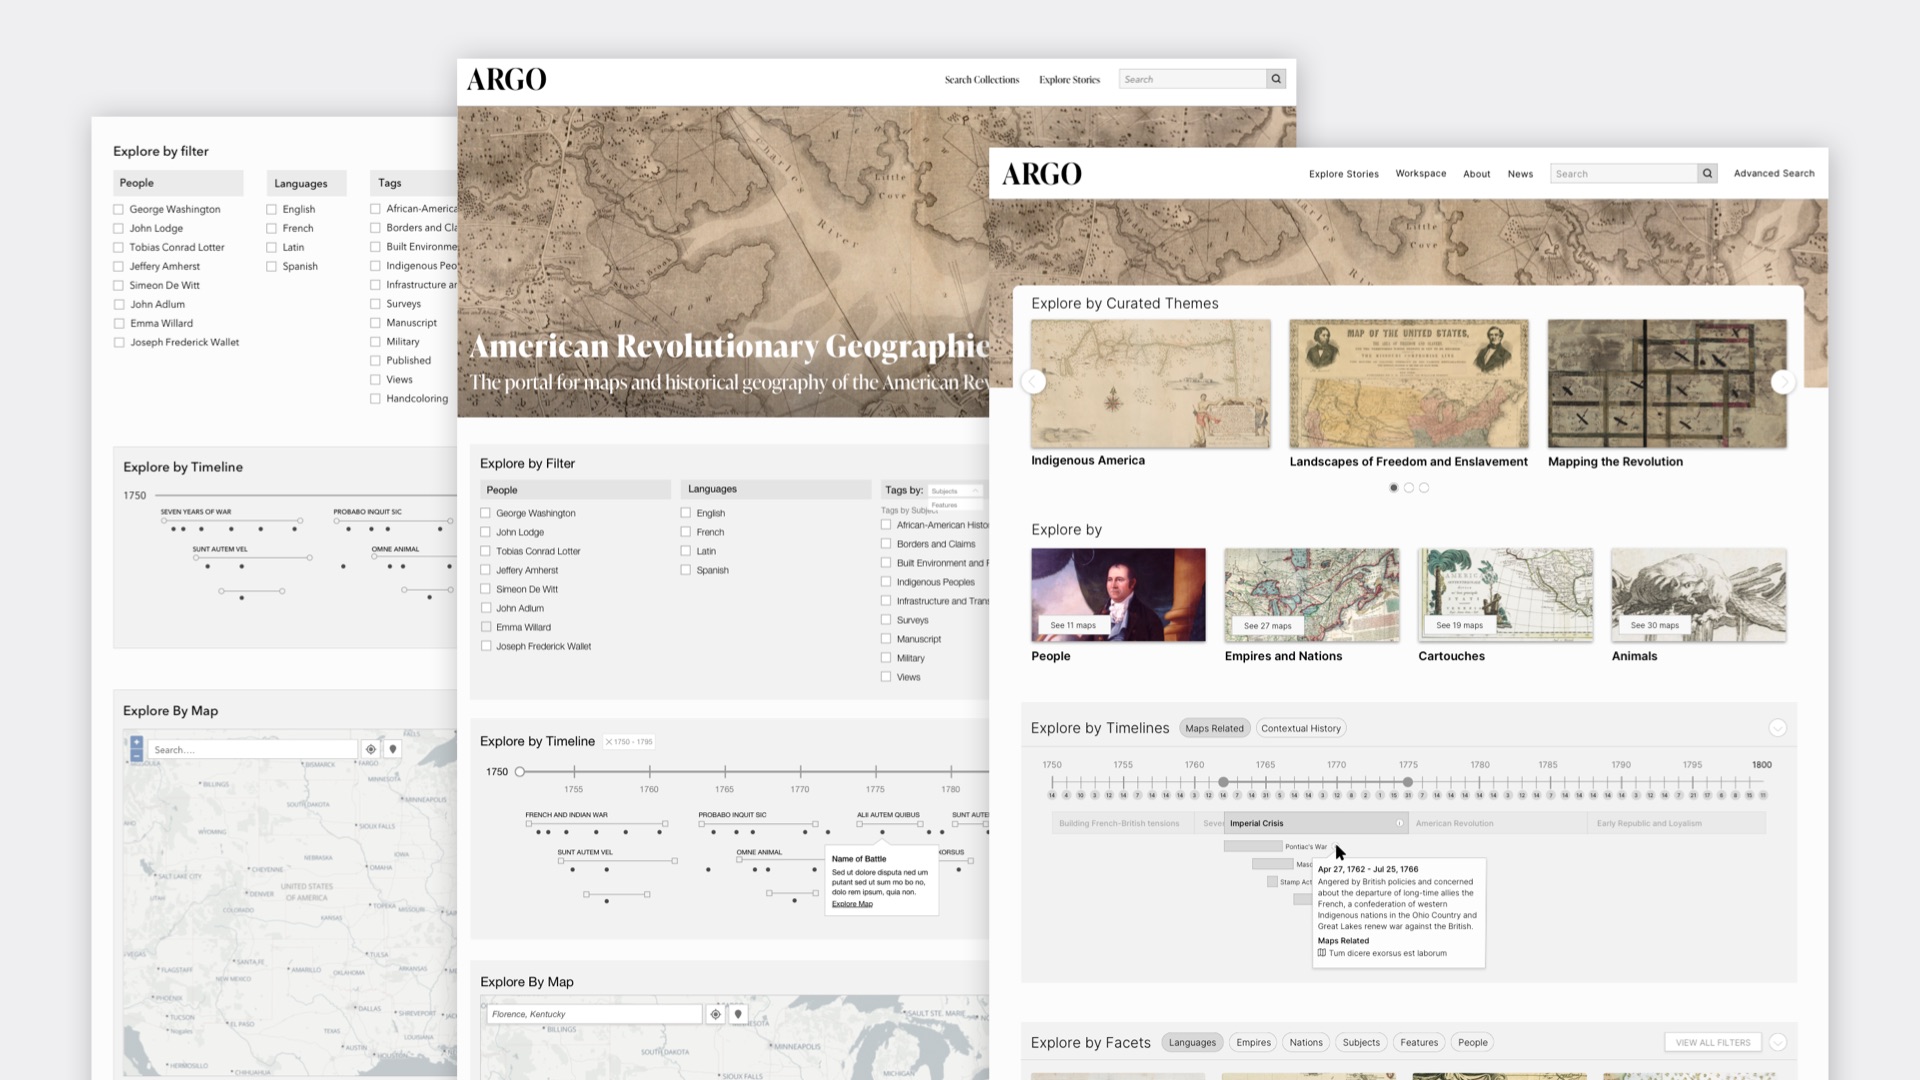
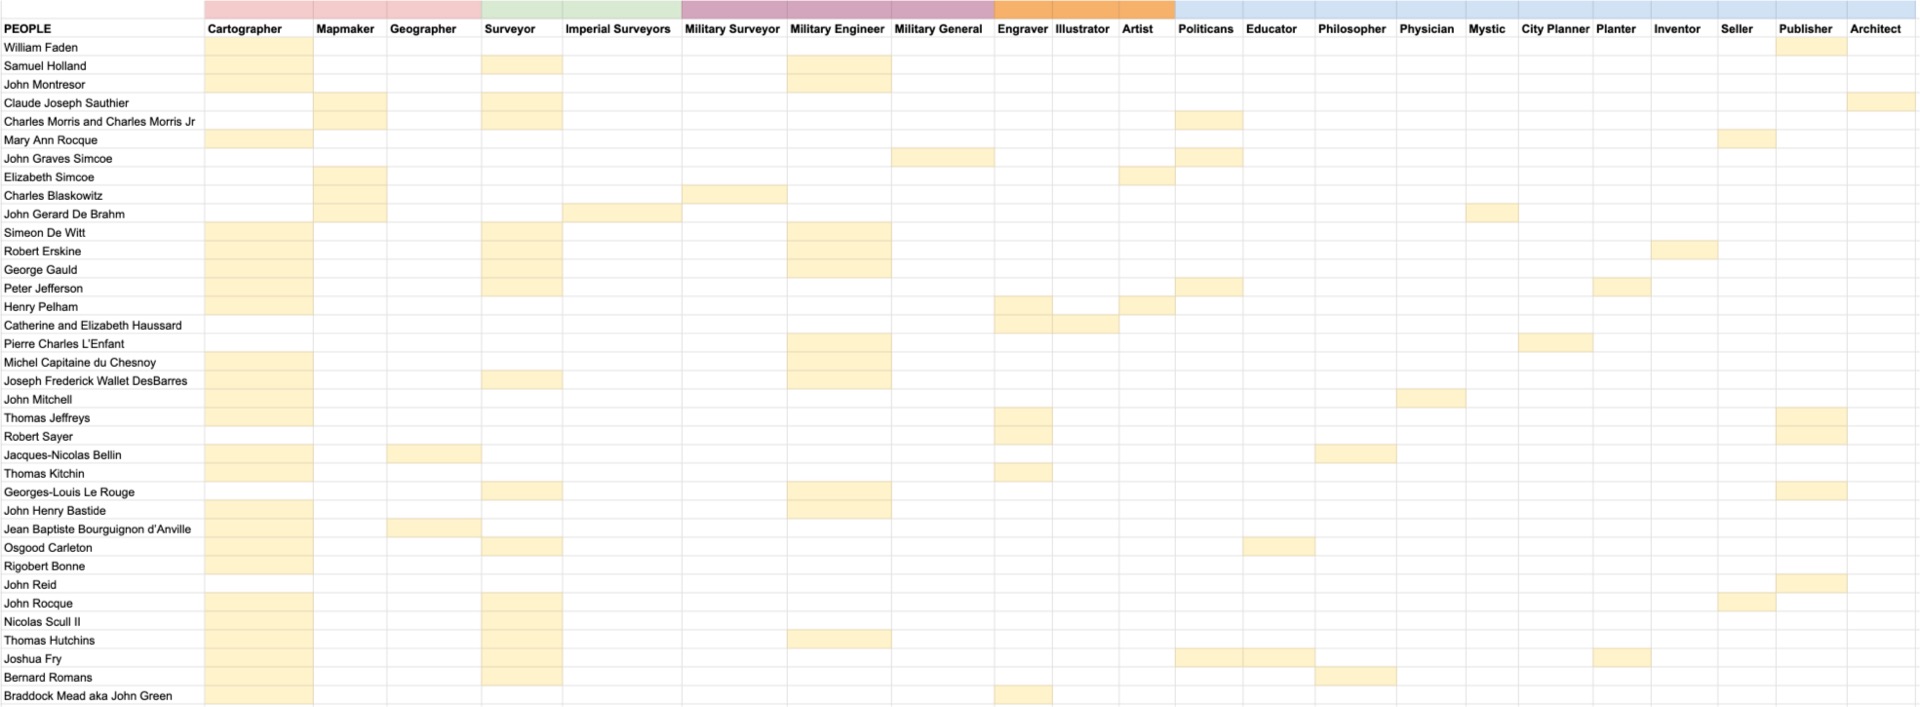
With a clearer understanding of who the people are and their needs, the different pathways of exploration needed to be defined. Luckily working with a team of passionate historians and map experts who were willing to think out of the box, made it easy. Explorations started using data-accurate wireframes, iterating often and continuously returning to the drawing board to find new ideas and improve current ones.
Timeline Interface
For visitors who are just coming back to the American Revolution for the first time since primary school, a timeline-based interface was designed to simplify the understanding of the Revolution's chronology. The questions became evident quickly: how much context should be given? And how should context be given?
To create context, the inclusion of eras to group events was proposed to make the information a lot more digestible. The idea of denoting the difference between a single day event and multi-day battle was also considered.
To explore these questions, proofs-of-concepts werd created to explore the interactivity and features of the interfaces.
After many iterations and side quests, a final design idea was found that allowed people to explore to quickly to grasp the revolution's duration, its distinct eras and find events with maps tied to them.
Search
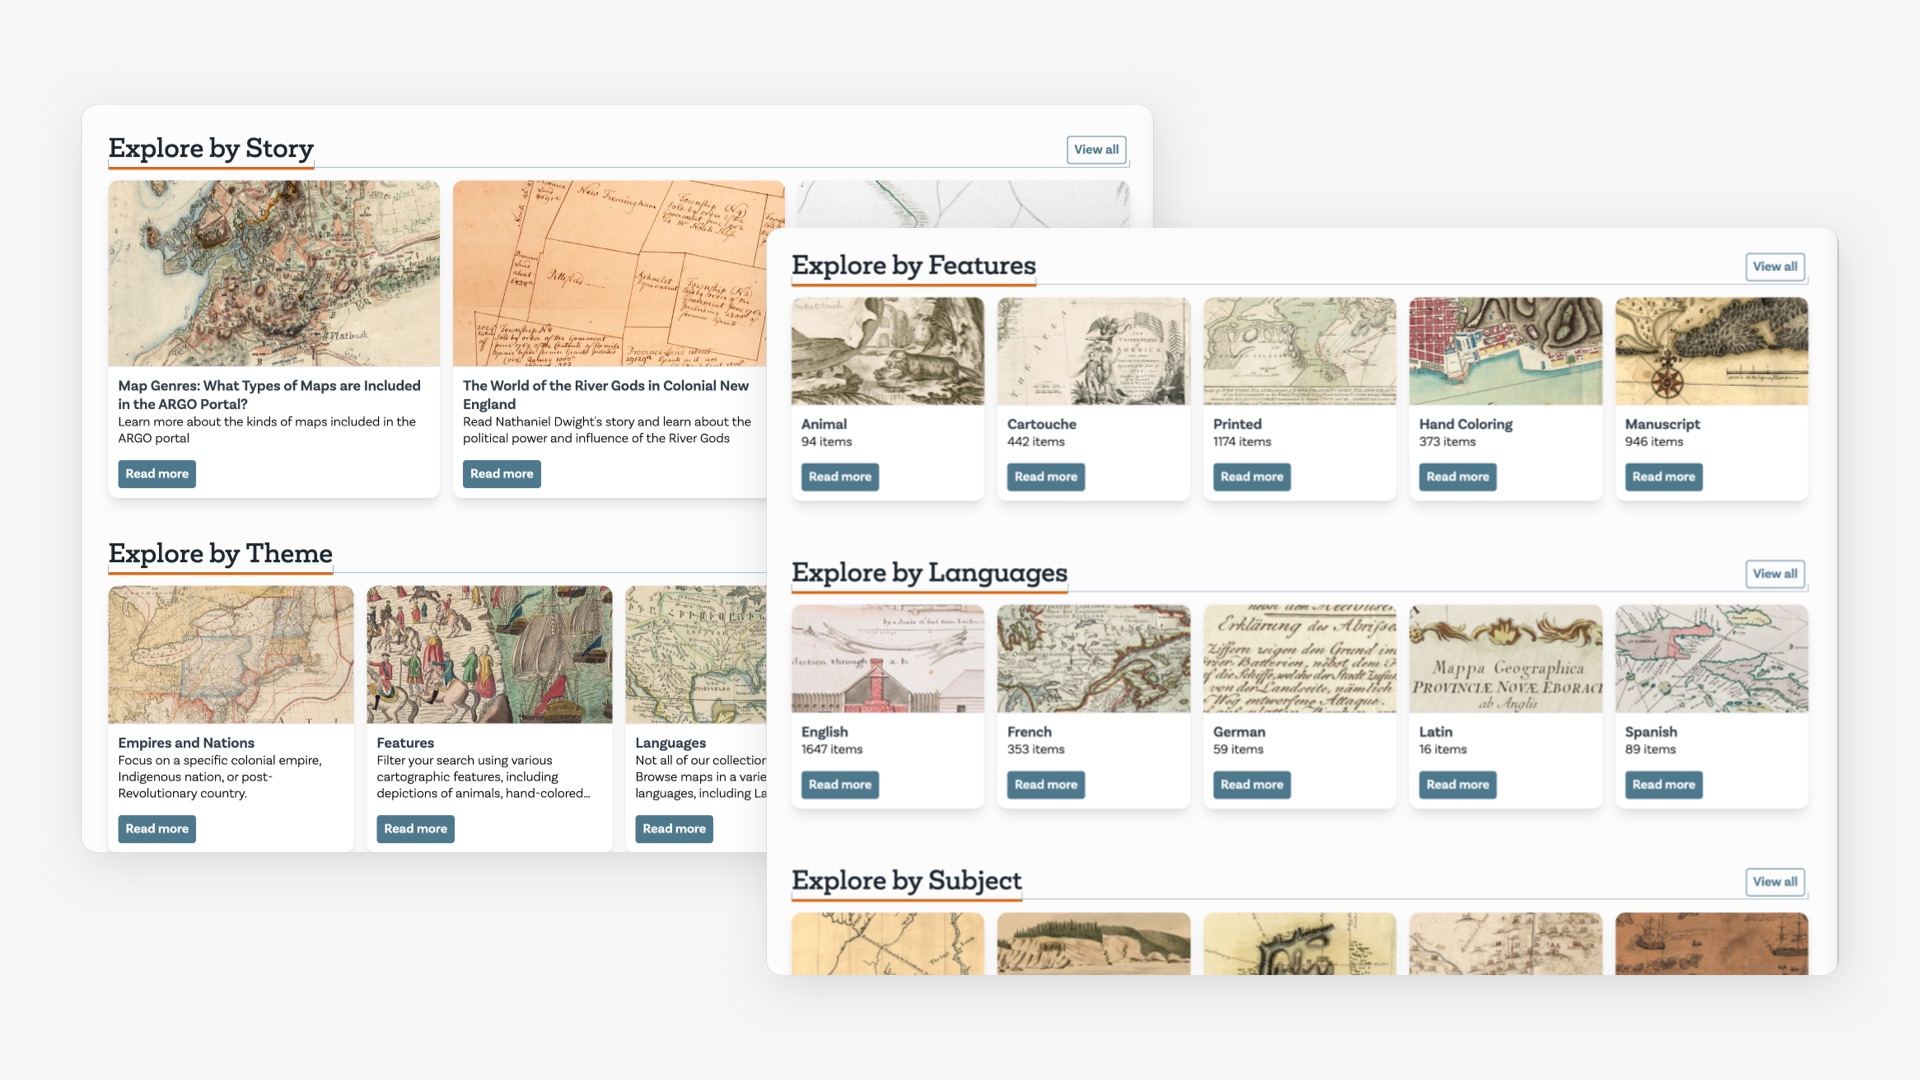
The advanced search system needed to support all the different ways the data set could be explored. Site visitors can start with a search term or just start by viewing all the maps and paring down by subjects, years, empires and other facets, as well as features like hand-coloring or marginalia to find just the right maps. (Unfortunately the live project doesn't support advanced searching at this time.)
Search by Map
When people explore any type of interactive map, they like to explore where they are located or places they'd like to visit. With this thought came an interface to explore the American Revolution Maps through a map itself. Could site visitors explore the data set by a location of interest? By map size?
Search by Map Features
Beyond geographic details, site visitors can engage with map elements, such as the intricate cartouches along the borders, and historical themes like the animals of the era, as well as people and languages.
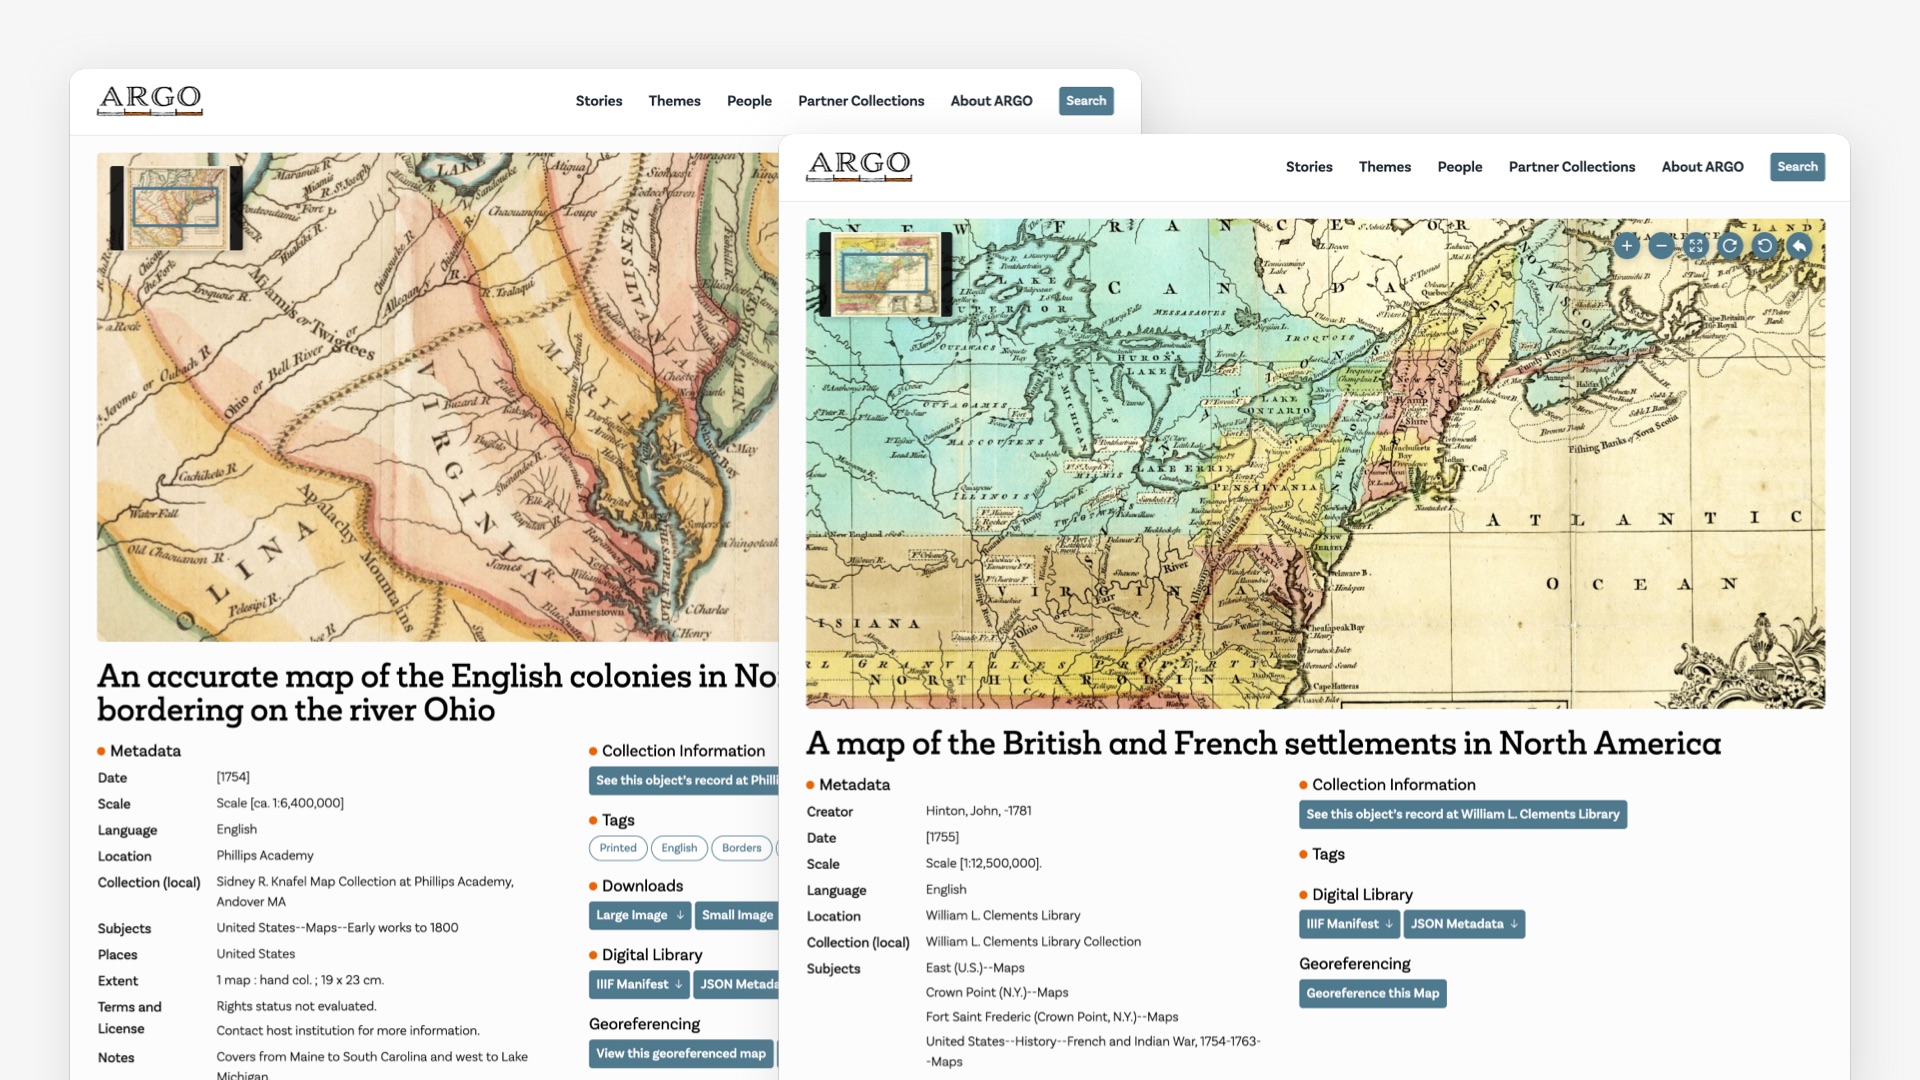
Map Page Detail Page
Each map can be explored in detail supplemented with meta-data to helped people understand the context of each map.
Conclusion
Working on ARGO maps was all about iterative, data-driven design and thinking about different ways to humanize a once static collection of maps. Now a over 1000 maps can be explored by various ways and level of depth through ARGO maps.
Designed while at Byte Studios
Sonal Jain - Designer
Michael Diedrick - Site Architect & Data / Content Strategy
Jozi Schneider, Travis Horstmeier, Ryan Golner - Developers
Get in touch
sonaljain.studio@gmail.com