data-driven design
visual identity
site design
Observation Deck: A Digital Toolkit for Librarians
Madison Public Library (MPL), in collaboration with Skokie Public Library (SPL) and Waupaca Public Library (WPL), sought out to develop a librarians toolkit under a IMLS funded project. Their goal was to develop a digital toolkit that would collect and analyze qualitative data in hands-on experiential library programs to support outcomes sharing to stakeholders and continuous cycles of improvement.
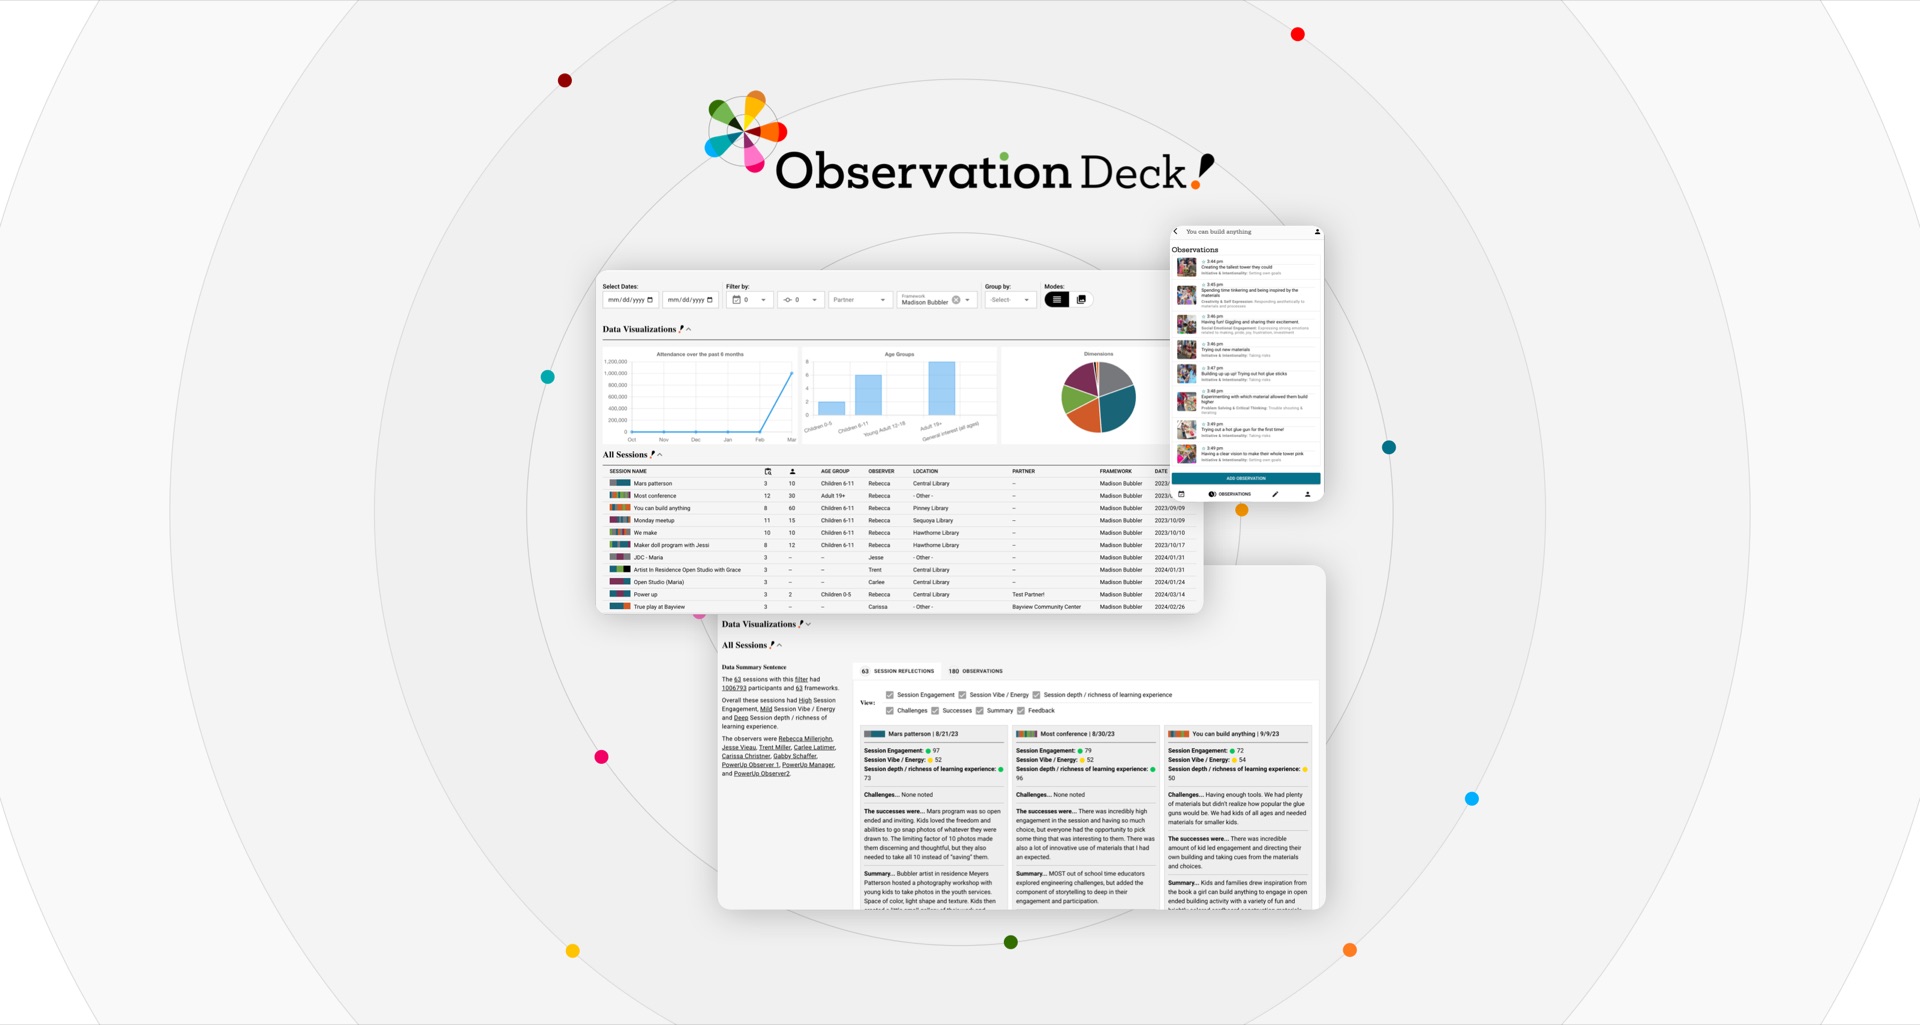
The Demand for Observation Deck
Public libraries are doing valuable work for their communities and the only way to showcase their impact has been through attendance and collection data. But, with more libraries nationwide shifting towards hands-on experiential learning such as in arts, maker or STEAM programs where outcomes are more qualitative, capturing and sharing the impact has been more difficult.
Observation Deck aims to fill this gap by building a digital toolkit that would allow librarians to capture stories to round out the library’s impact beyond traditional data metrics in a systematic and organized manner.
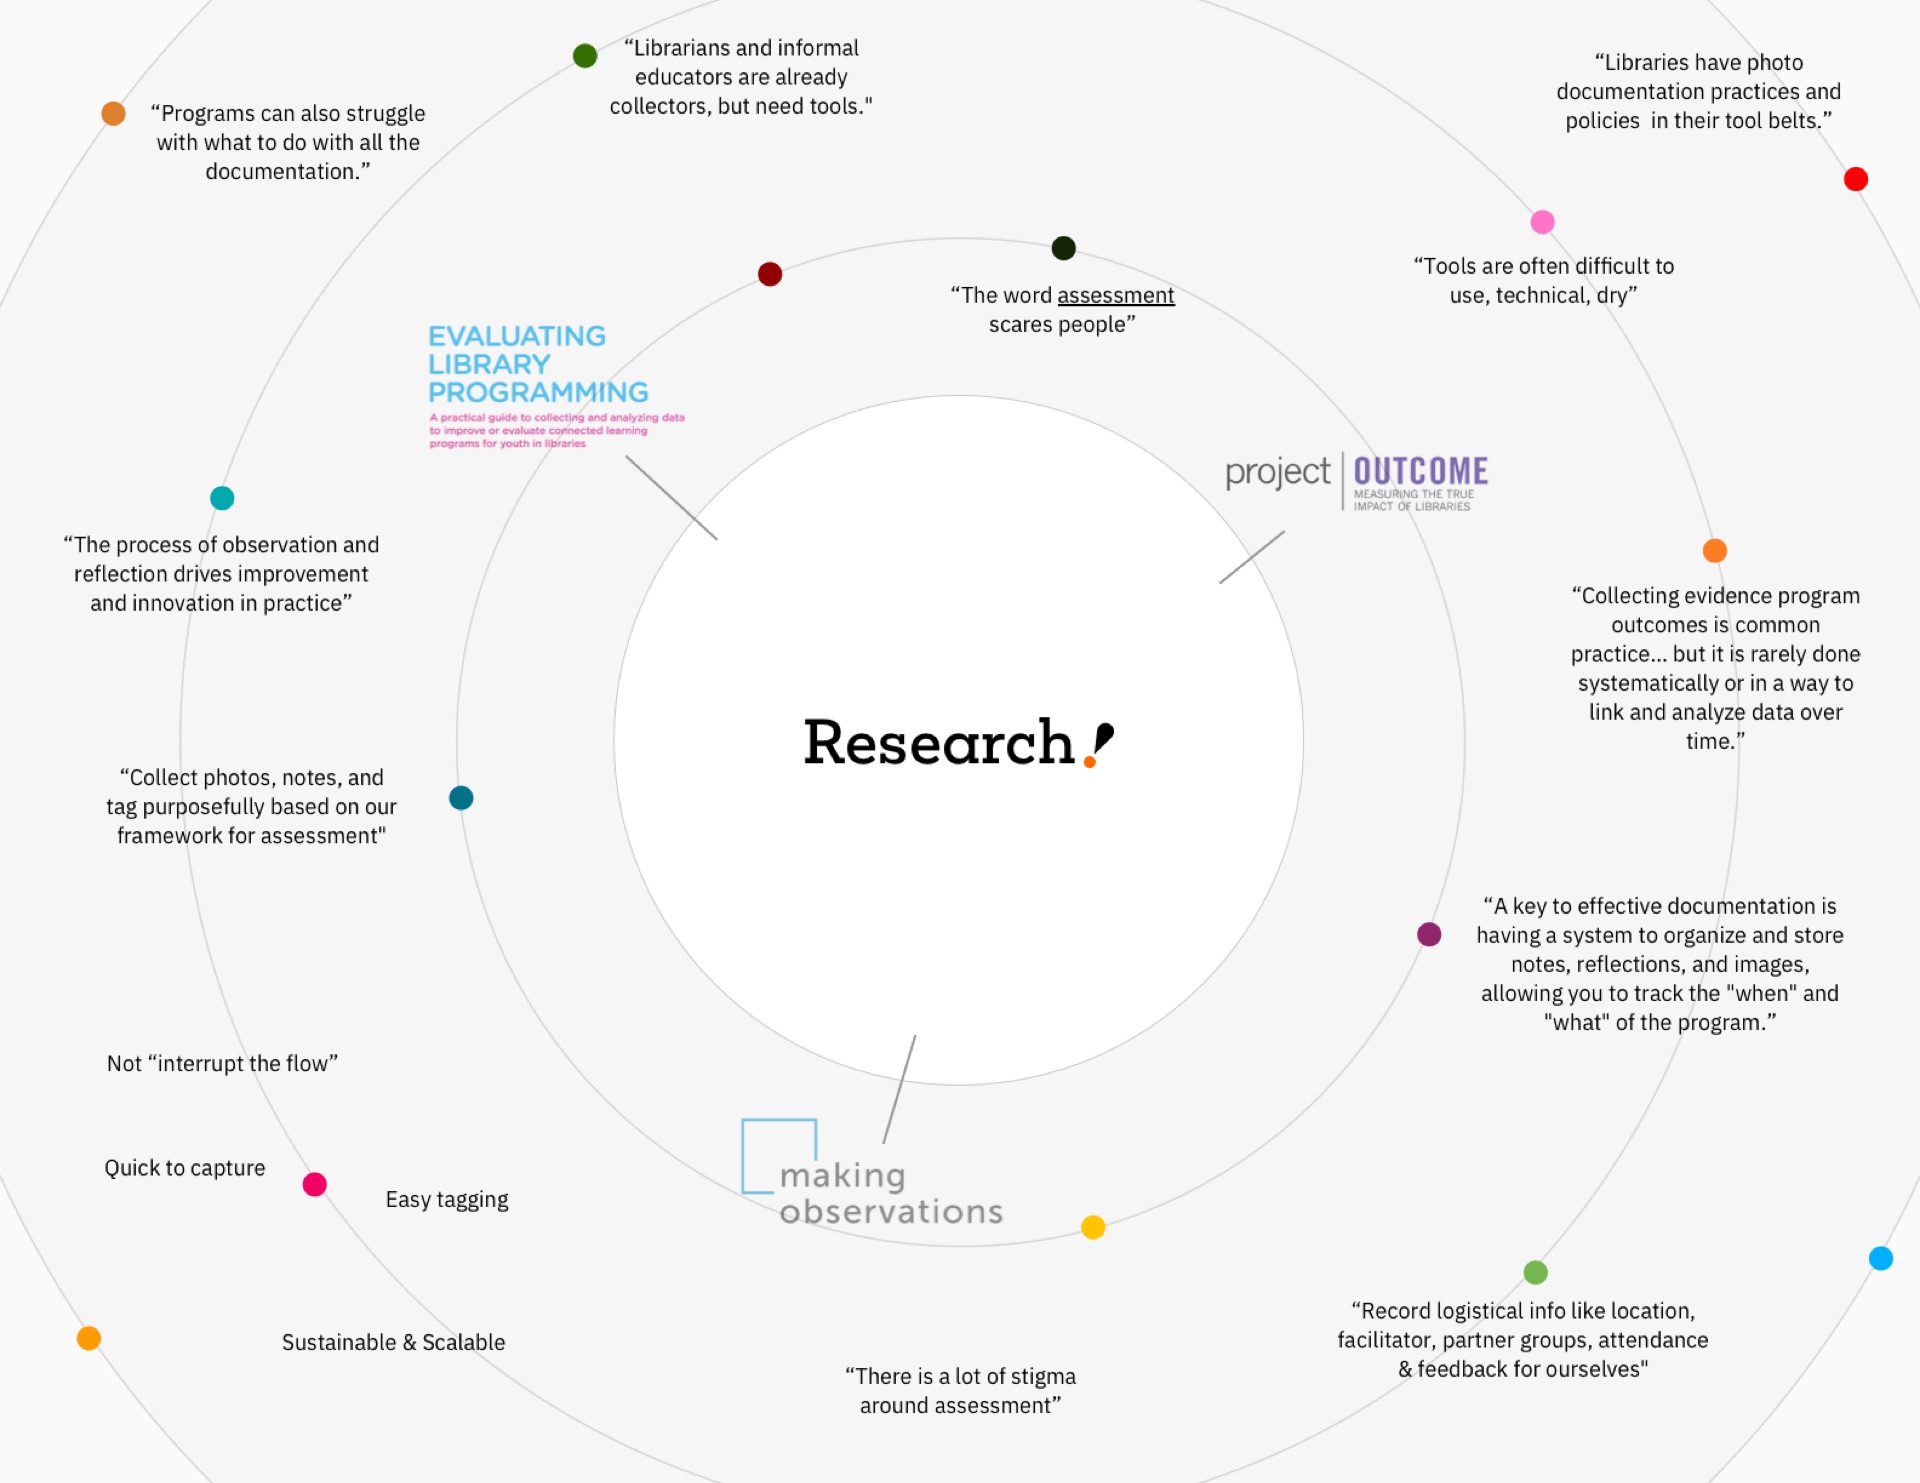
Understanding the Research & Project Goals
Byte joined the project as the developer through a three-year IMLS grant. MPL approached us after conducting comprehensive research in existing practices and tools within the observational assessment and informal library field. They also conducted a nationwide library survey to identify technological barriers and determine meaningful outcomes to capture and share.
This research informed the decision to make it open source and web based and the creation of institution-specific observational frameworks. It also defined the core functions of the toolkit:
Data Collection tool
Designed to capture multimedia, tag data based on a predetermined observational framework, and integrate seamlessly into the workflow without causing interruptions.
Data Analysis Tool
Developed to support exploration and facilitate continuous improvement cycles by identifying opportunities for enhancement and aiding in sharing outcomes with stakeholders and library teams for informed future decision-making.
Sustainable and Expandable Model
Engineered to be scalable and ready for dissemination to a large number of national partners, ensuring broad applicability and longevity.
Ideating to define function and features
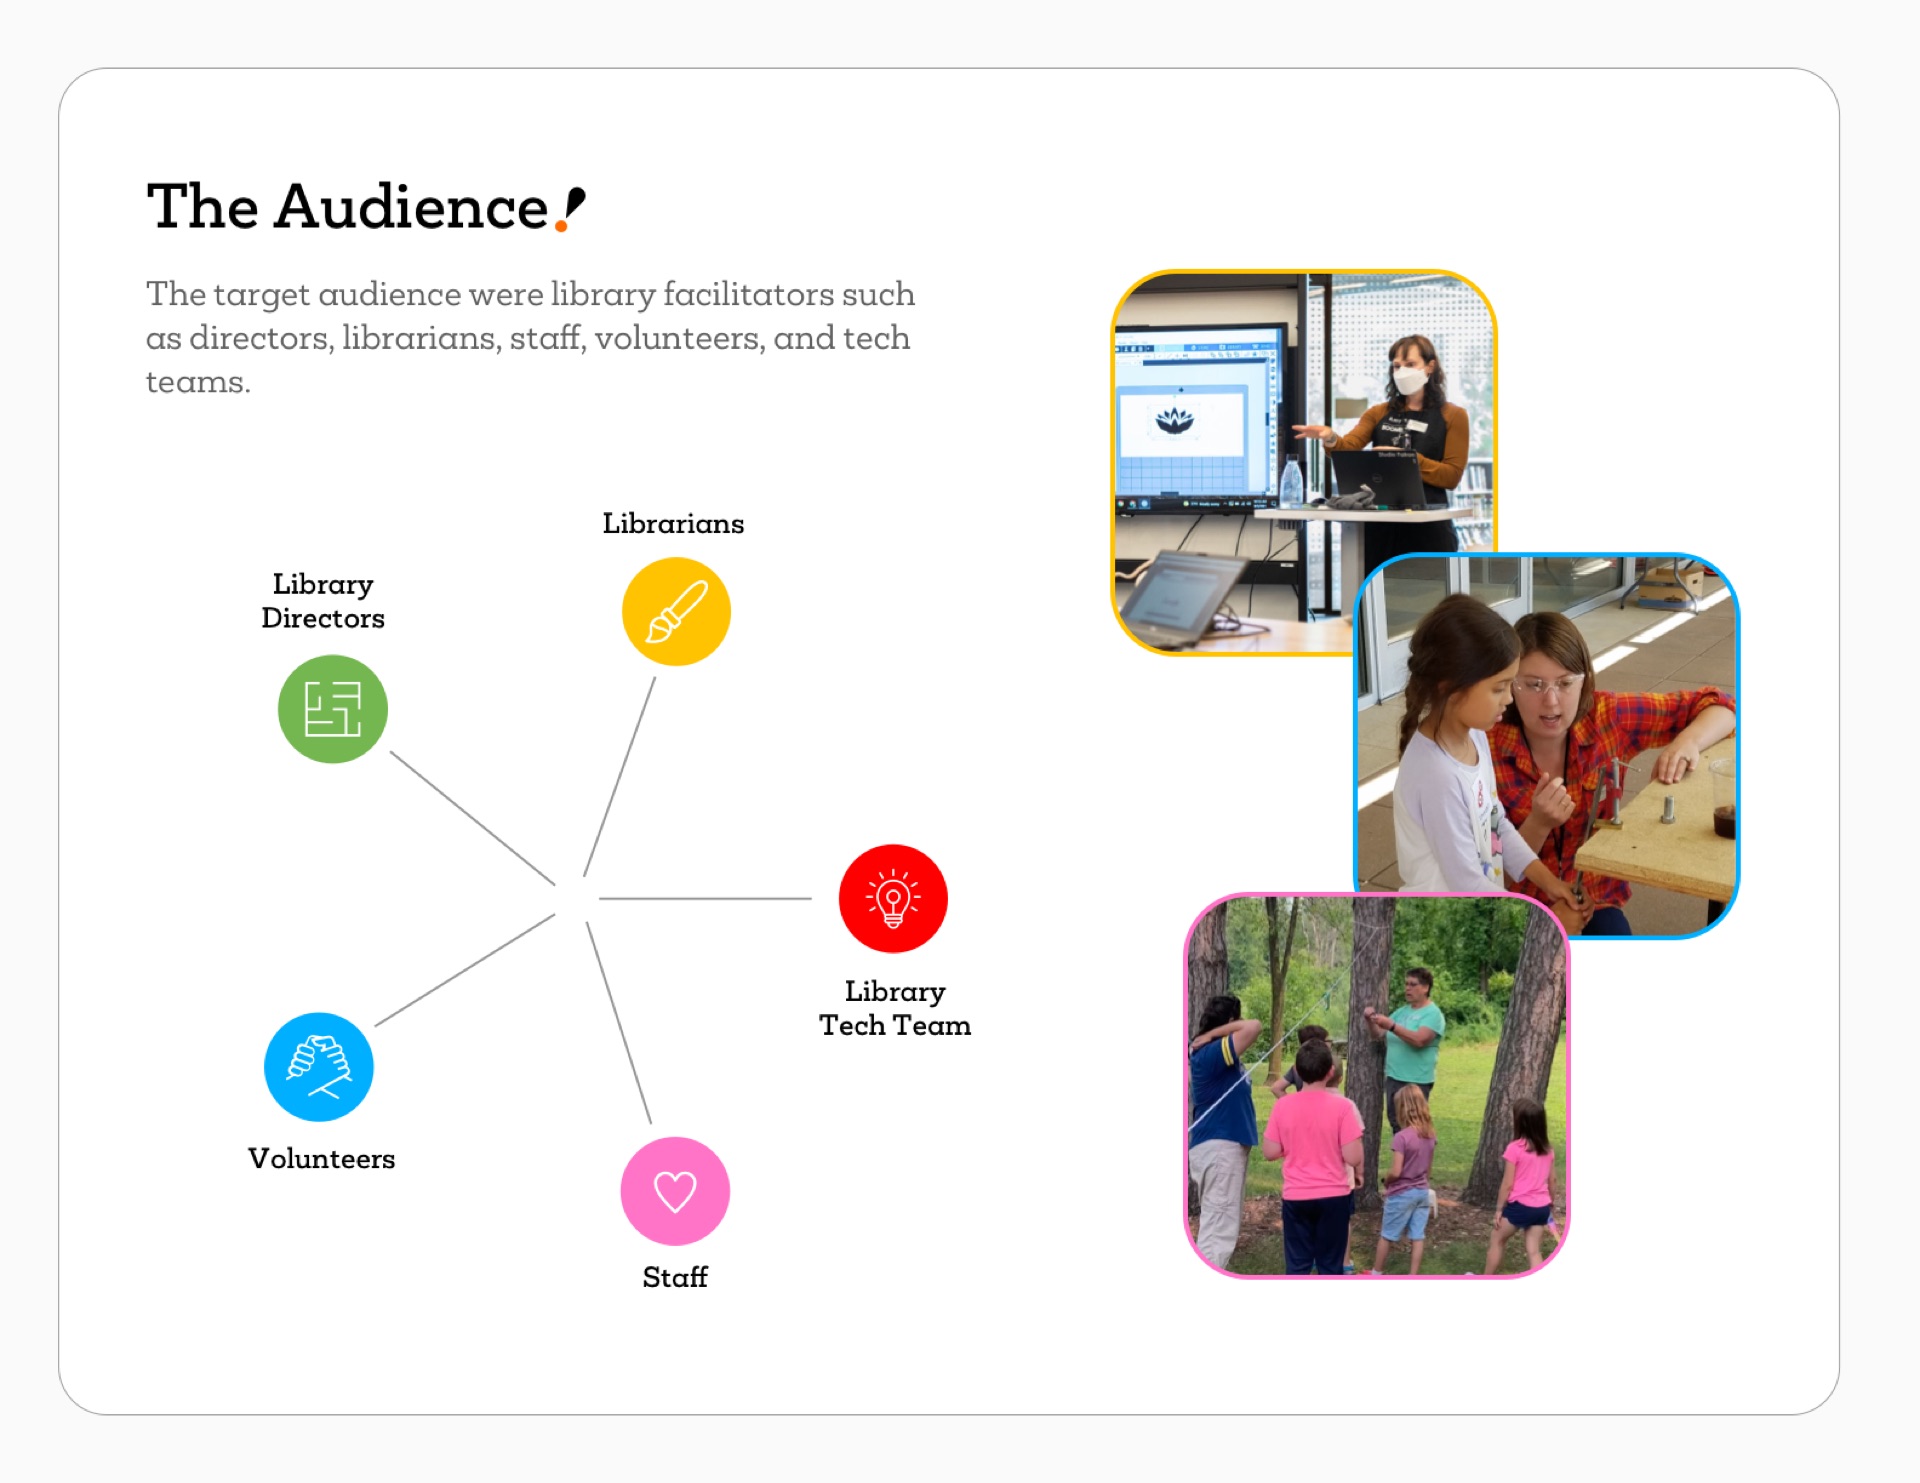
With a deep grasp of the research, we conducted fieldwork by participating in diverse library programs across the three partner libraries. This experience helped us understand how the toolkit would be used across libraries of different sizes and objectives.
Prototyping Early and Frequently
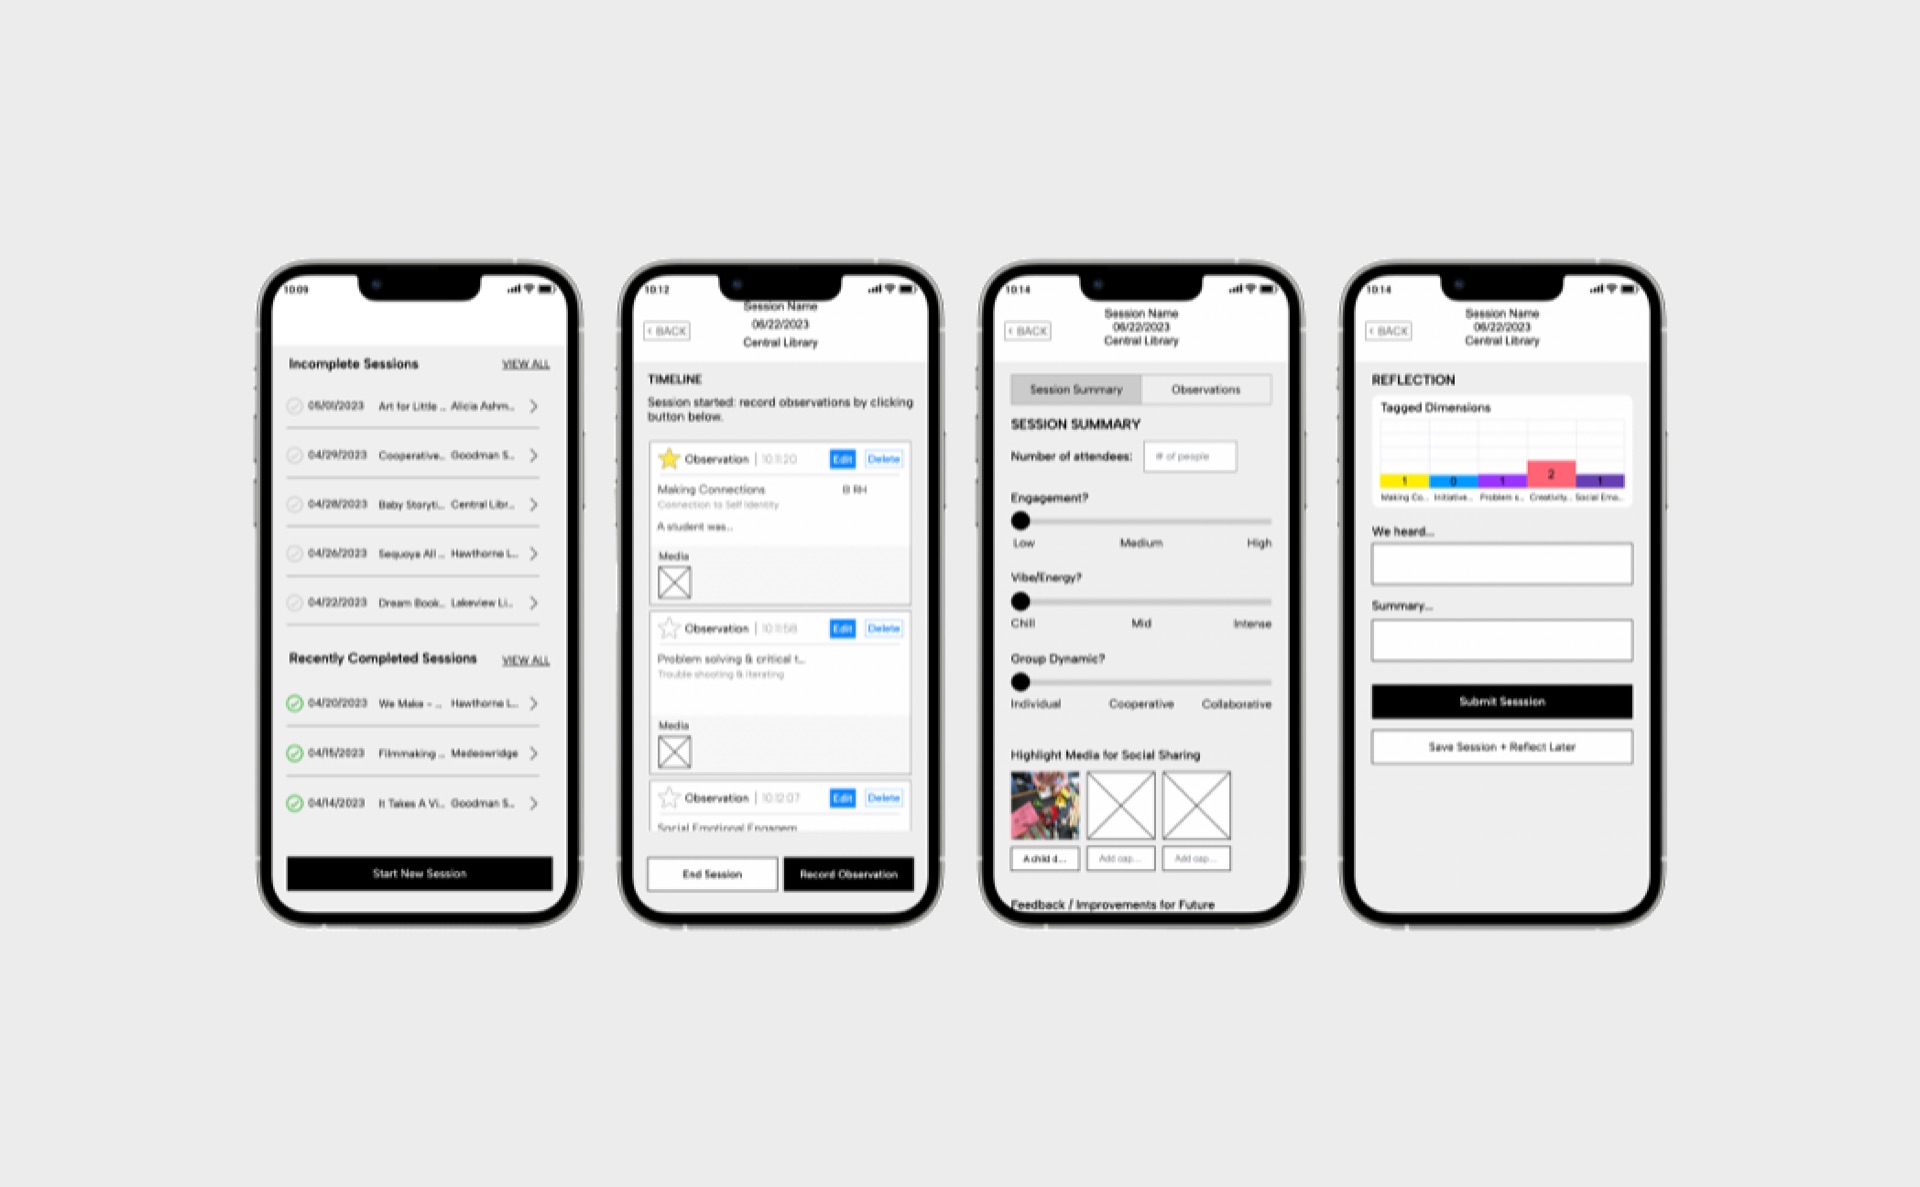
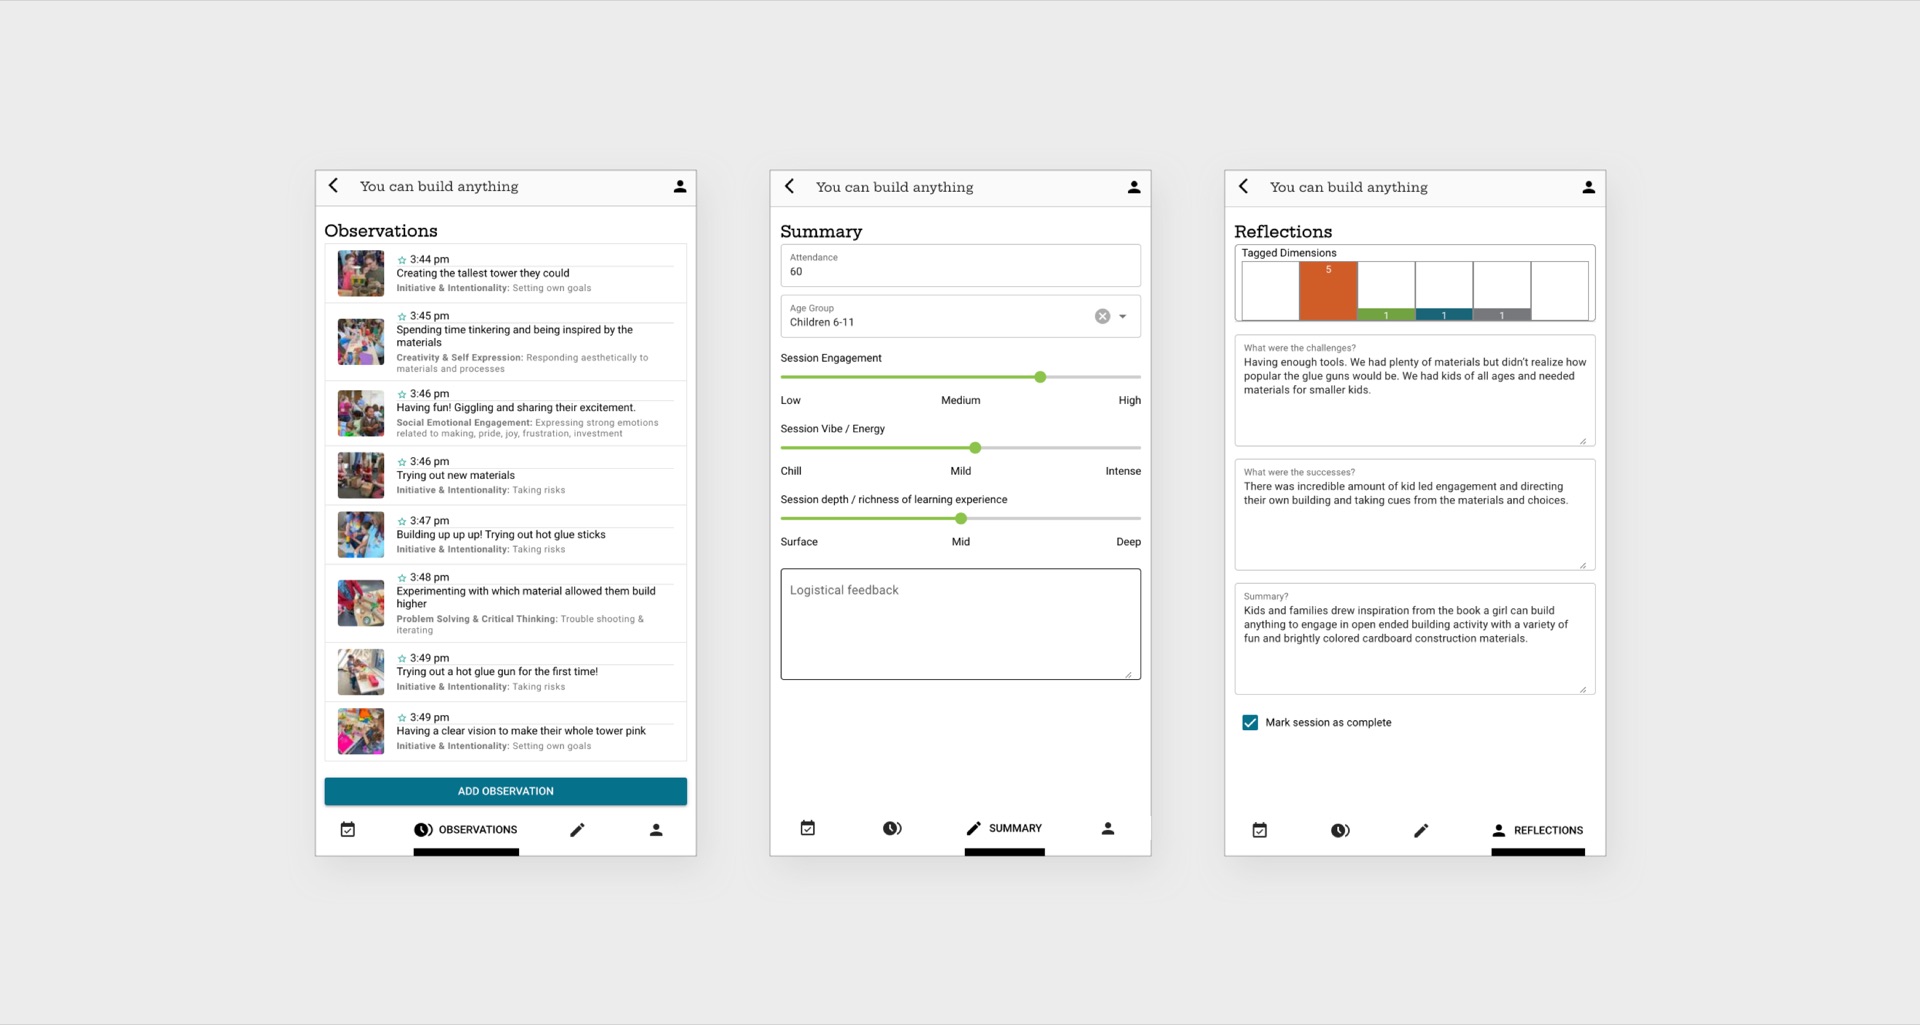
The process began with defining a mobile-first application for data collection through iterative prototyping. Recognizing the need for a workflow that would enable rapid testing and iteration, tools were selected that allowed for real data simulation and seamless version sharing with the client.
Prototyping focused on several key aspects: incorporating all the specified features, refining the user journey, and enhancing the overall user experience. During this phase, the prototypes helped clarify different user types, their hierarchical relationships, and their respective capabilities. The user journey was carefully mapped out from start to finish, clearly defining each stage: login/sign-up, home screen/dashboard, details, timeline, session summary, and session reflection. Alongside this, the UI system was continuously upgraded to ensure an intuitive and user-friendly interface.
Beta Version
The culmination of this iterative process was a beta version of the data collection tool, which was deployed for use by the three partner libraries. This allowed for real-life data capture, providing a valuable dataset that would later be used to test and refine the data analysis tool.
Designing the Data Analysis Tool
With the data collection tool in place, attention turned to designing a robust data analysis tool.
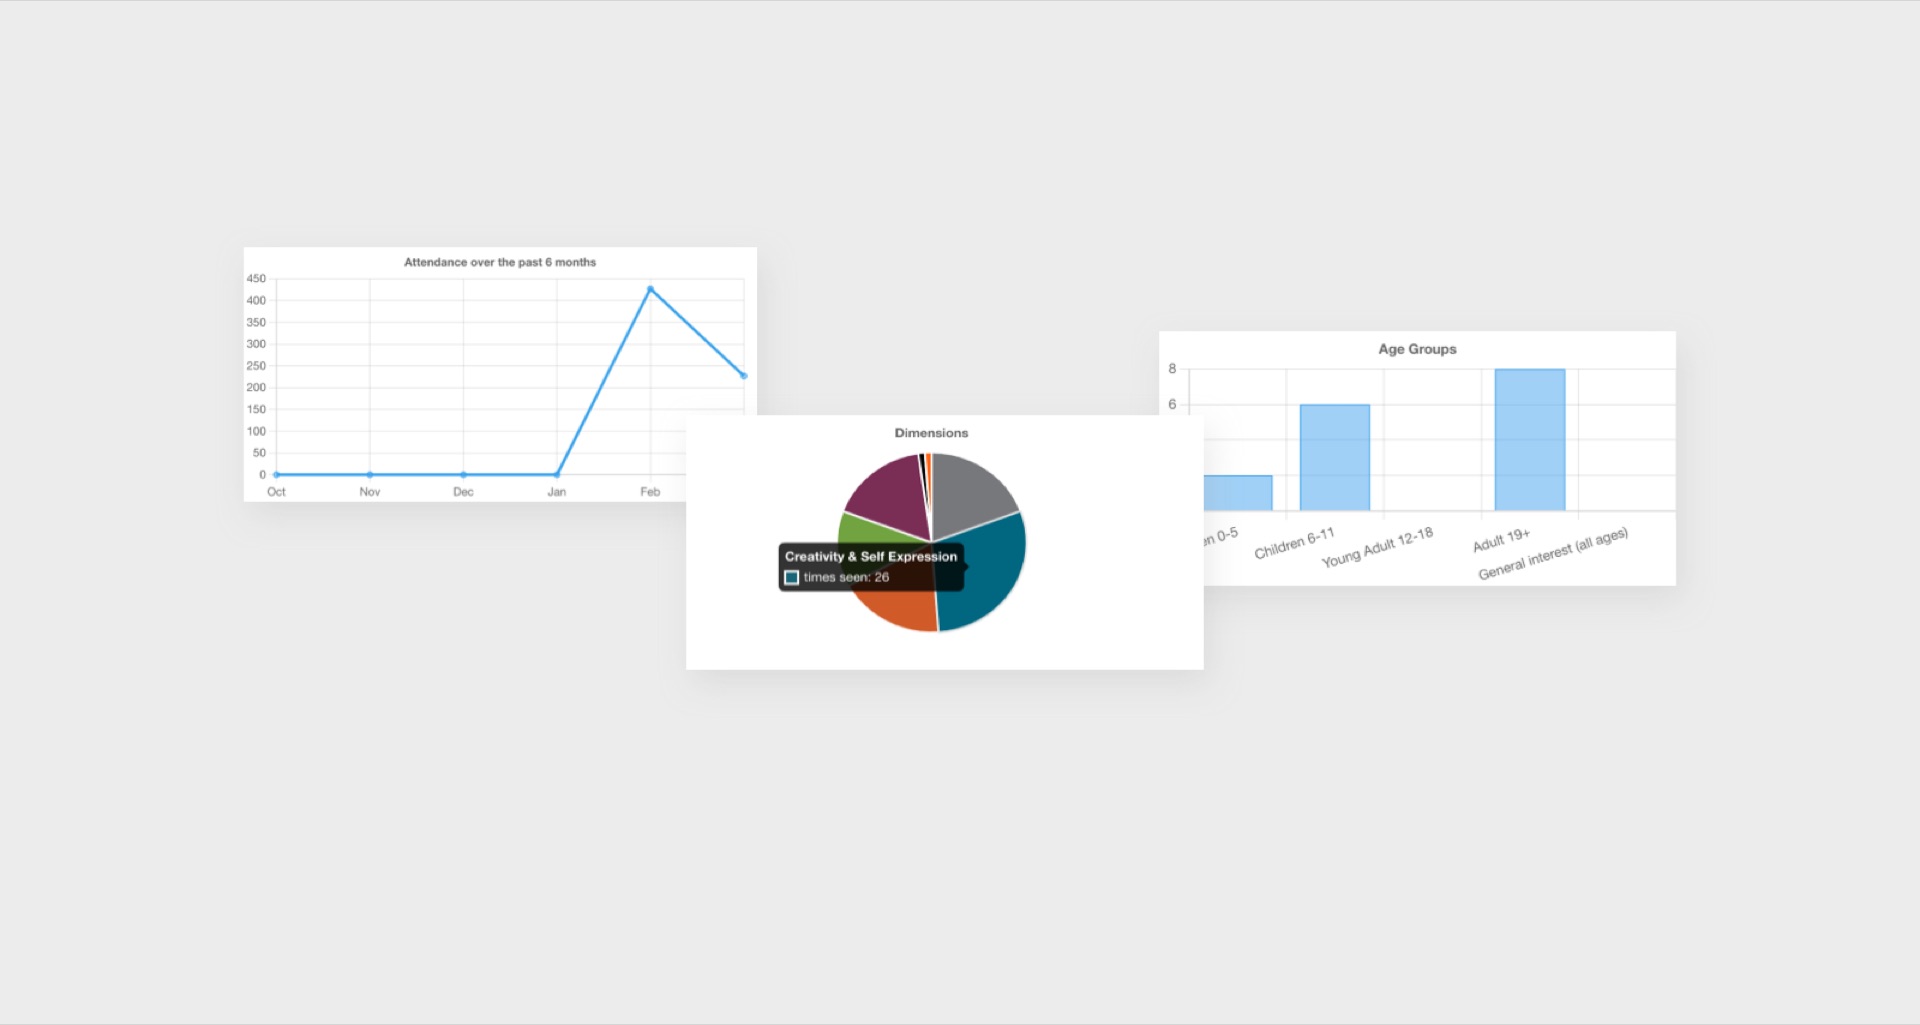
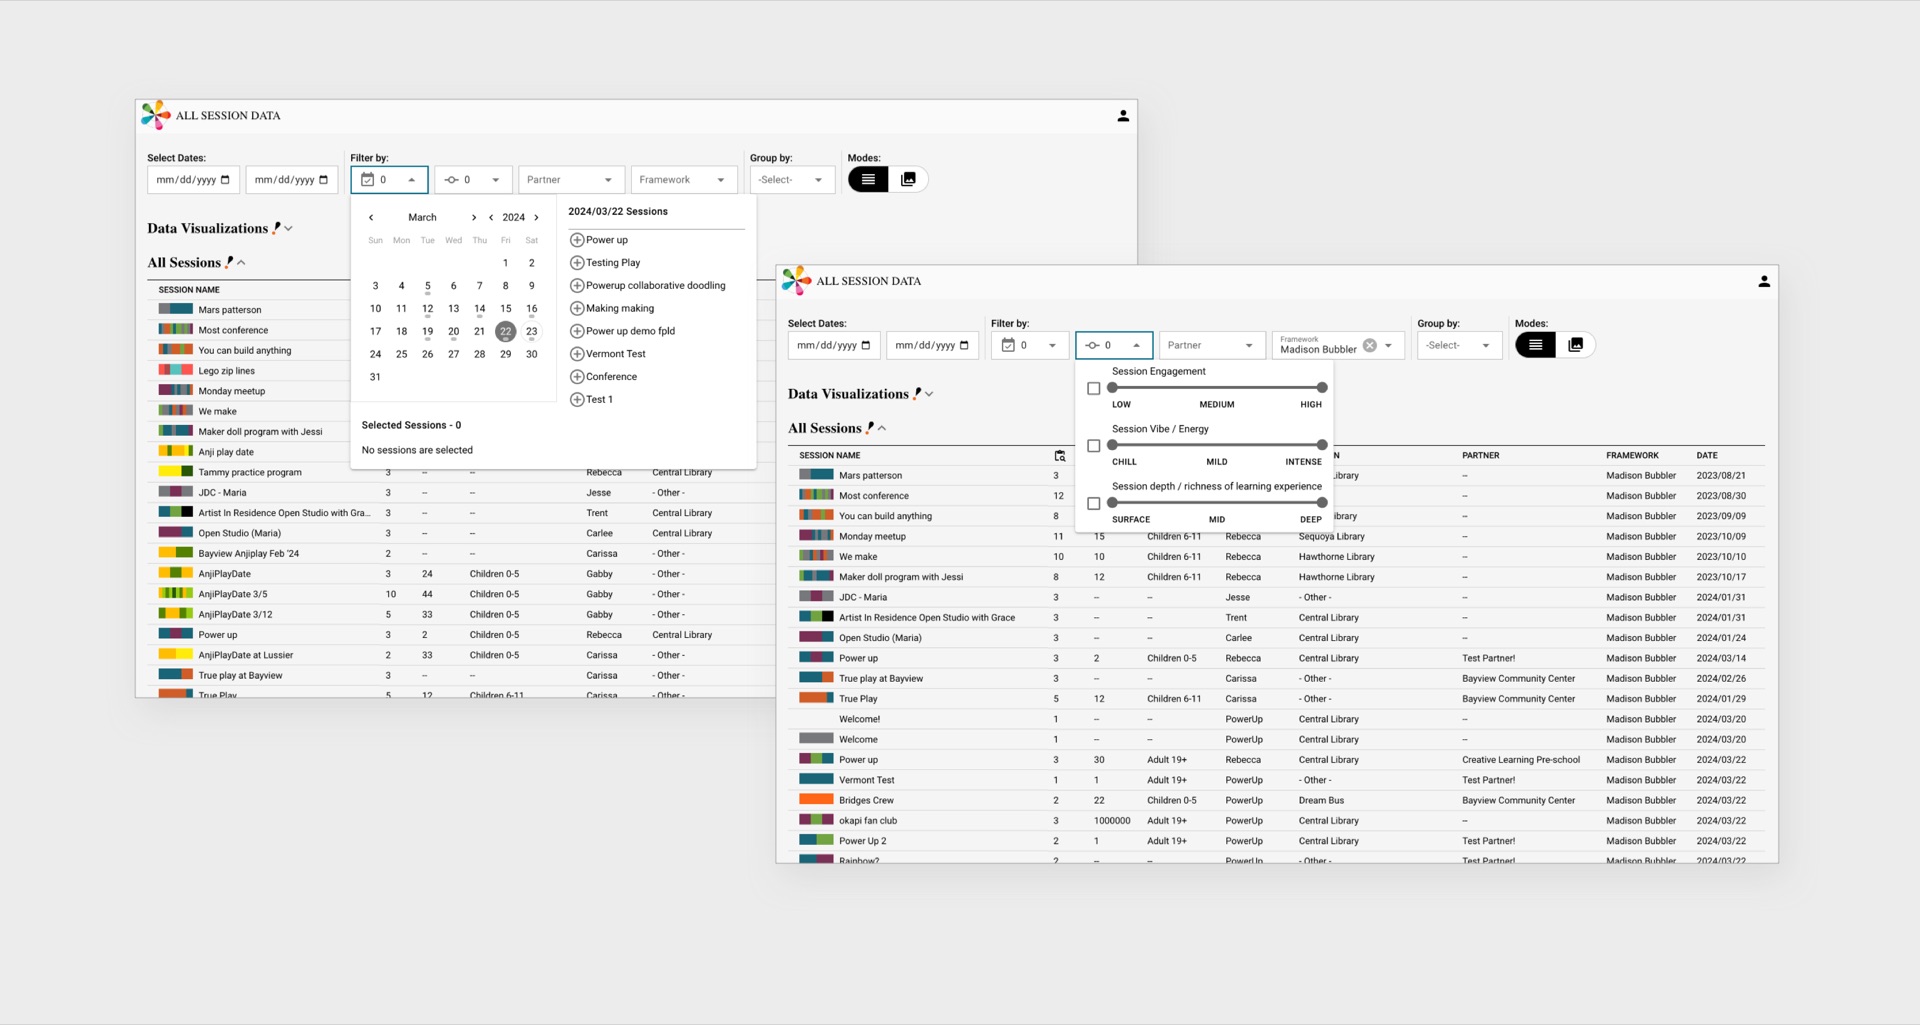
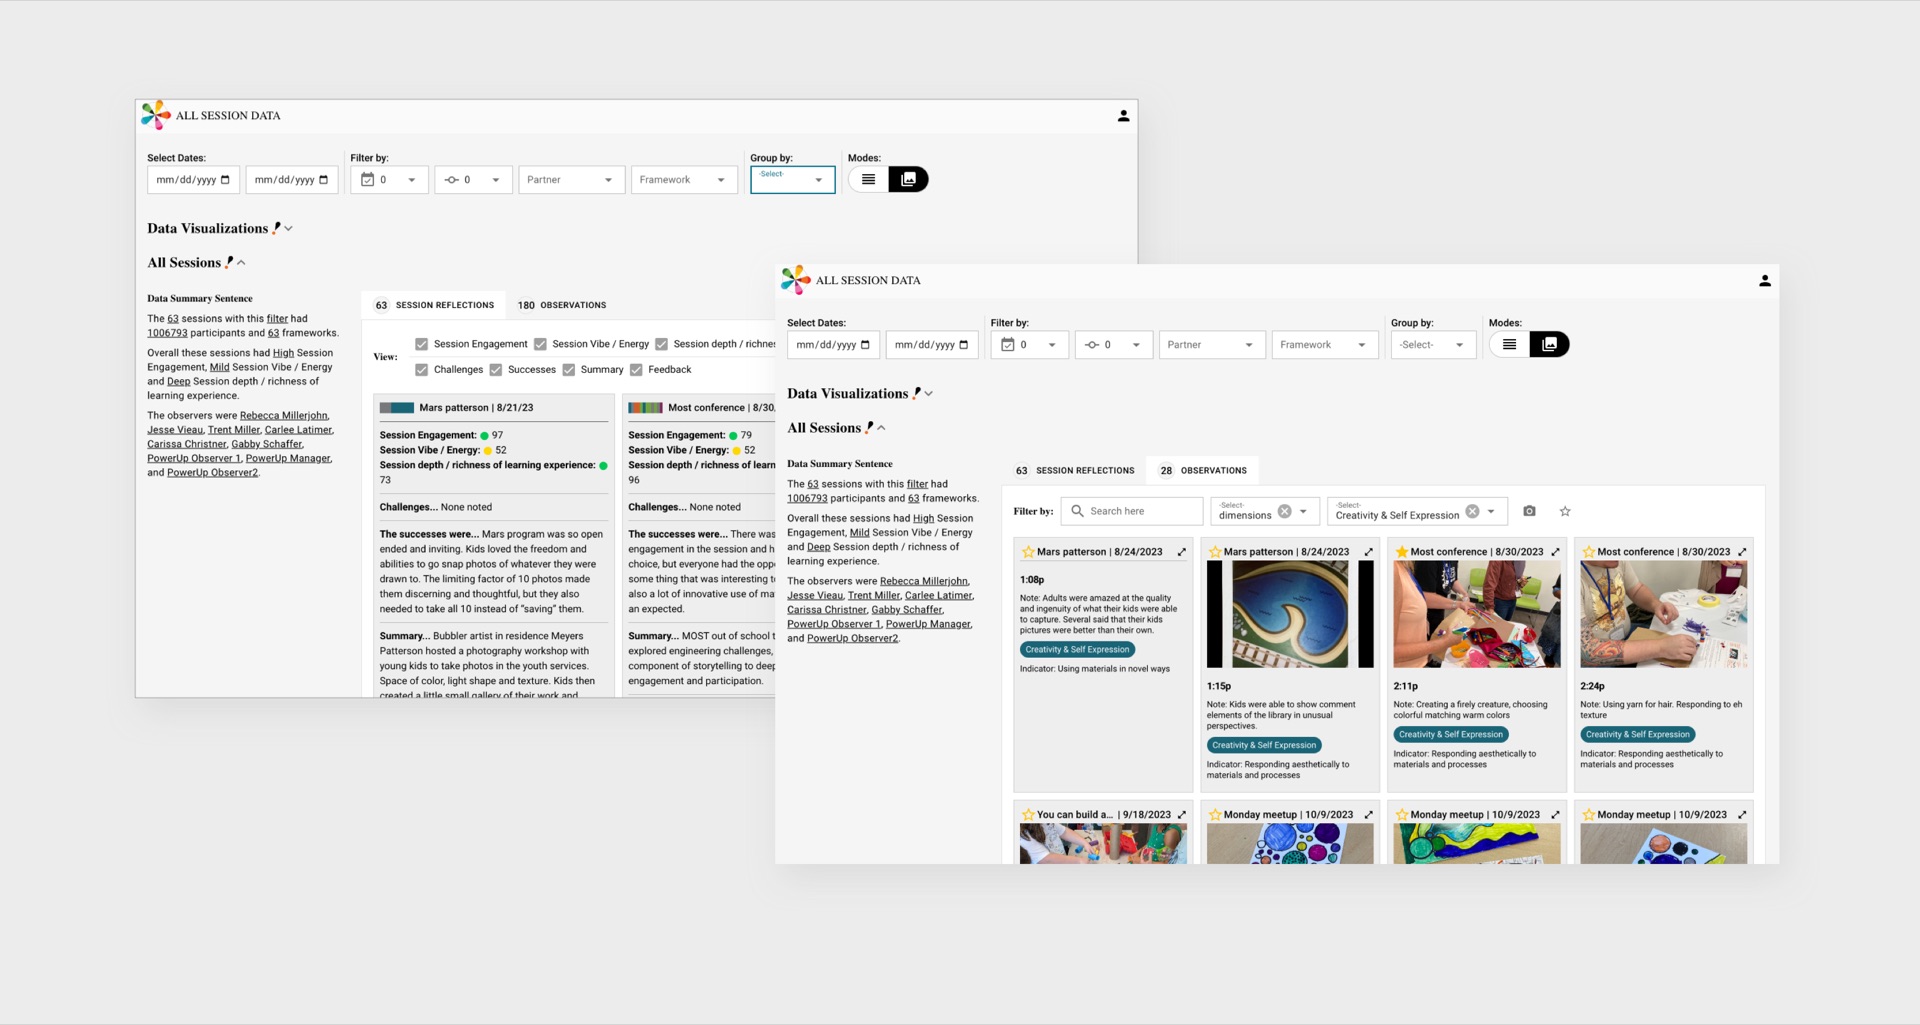
The analysis was initially categorized into four main types: A) Series/partner-specific data analysis, B) Social media/newsletter reporting, C) Feedback reporting, and D) Quarterly/semester analysis.
These categories were further broken down into specific use cases, which were validated against the real needs of librarians. This validation process led to the development of a systematic analysis tool equipped with robust filtering, grouping, and mode options, enabling comprehensive data exploration tailored to the users' needs.
Defining Technology Stack
With the core brand elements defined, the next step was to extend KCPL’s identity across various collateral, including the website, staff business cards, patron checkout cards, and wristbands.
Technology Stack Selection
The technology stack was carefully selected with a focus on developer experience (DX) and project needs, rather than simply opting for the latest technology. Directus was chosen as the data and authentication provider due to its open-source nature, robust data handling, and support for REST/GraphQL. Vue + Quasar was selected as the framework for its effective routing and state management capabilities without adding unnecessary complexity. Additionally, the Quasar UMD version was utilized to eliminate the need for a build step, further streamlining the development process.
Developing a Brand
From the start, the objective was clear: develop a brand identity that countered the prevalent weariness surrounding assessment tools in learning environments. The brand needed a look and feel that was approachable, vibrant and inviting.
Name Development
The journey began with the naming process. The chosen name needed to draw a connection to the core function of the toolkit. To do so, a naming framework was devised to explore various options. After extensive brainstorming and iteration, "Observation Deck" was selected.
The journey began with the naming process. The chosen name needed to draw a connection to the core function of the toolkit. To do so, a naming framework was devised to explore various options. After extensive brainstorming and iteration, “Observation Deck” was selected.
Moodboards
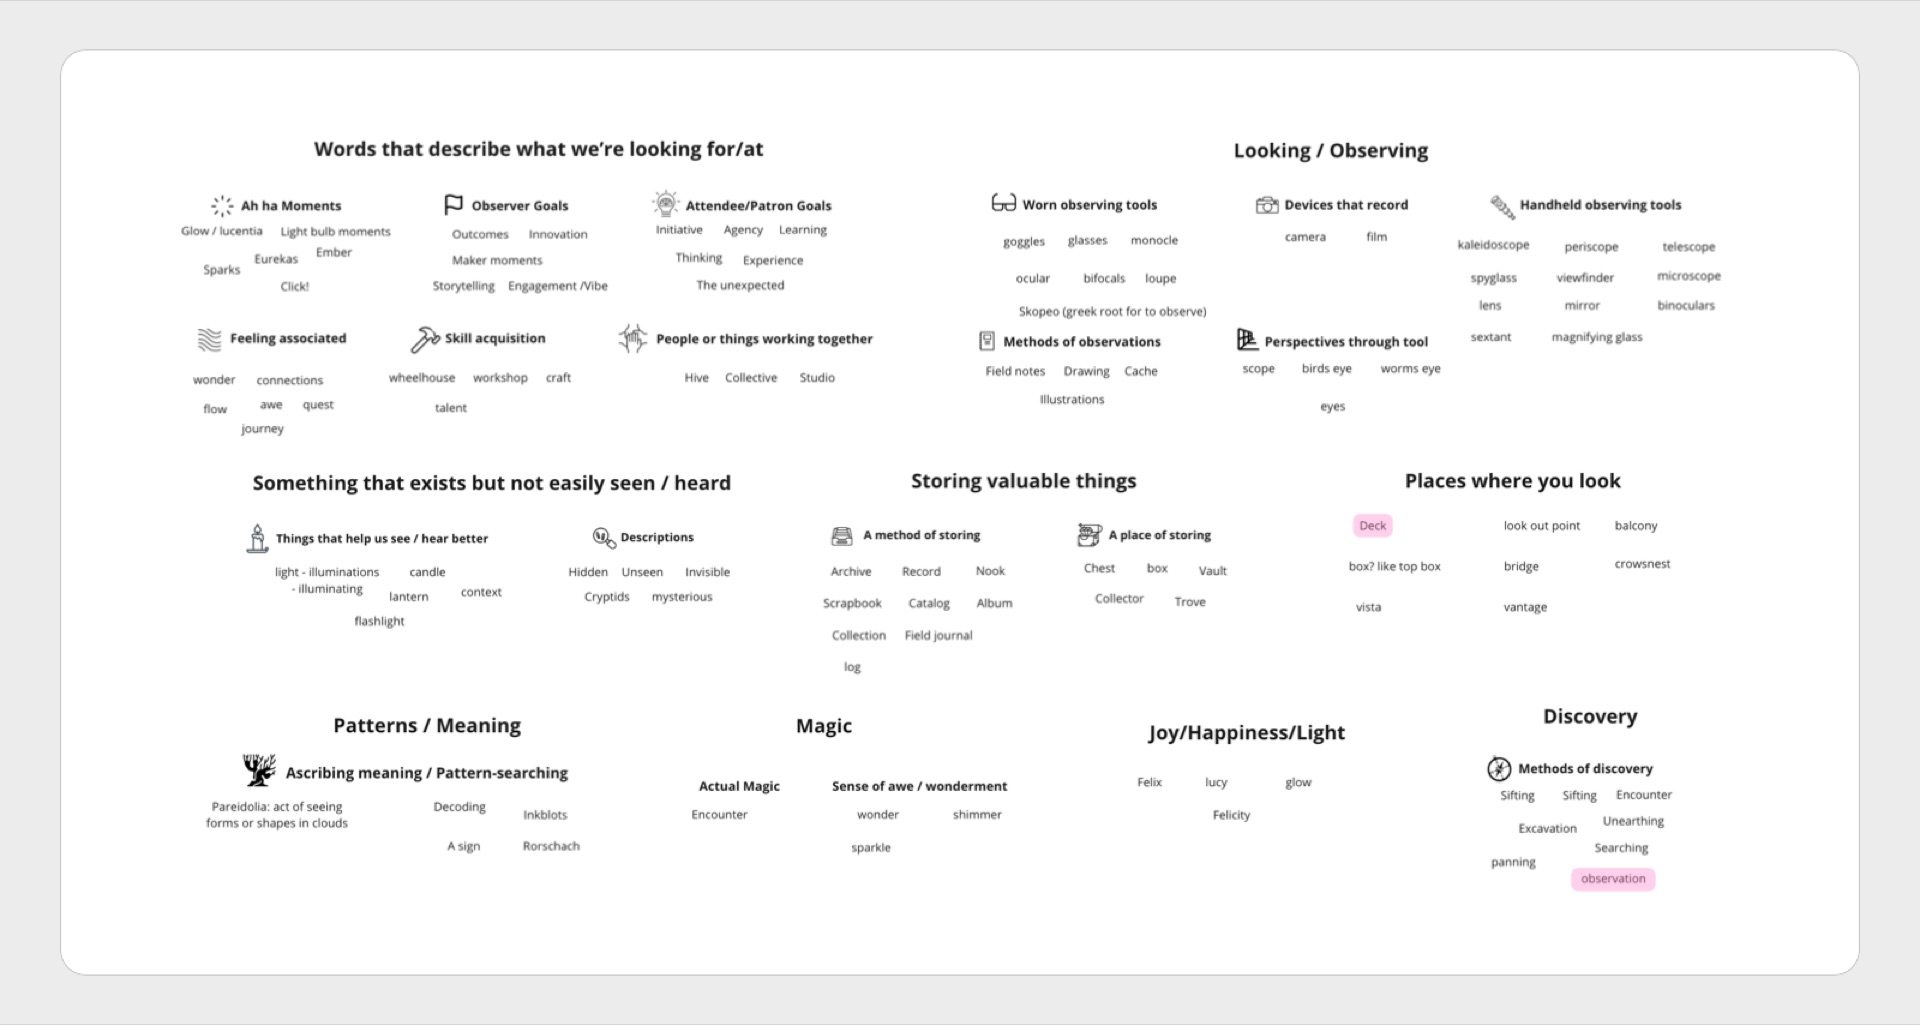
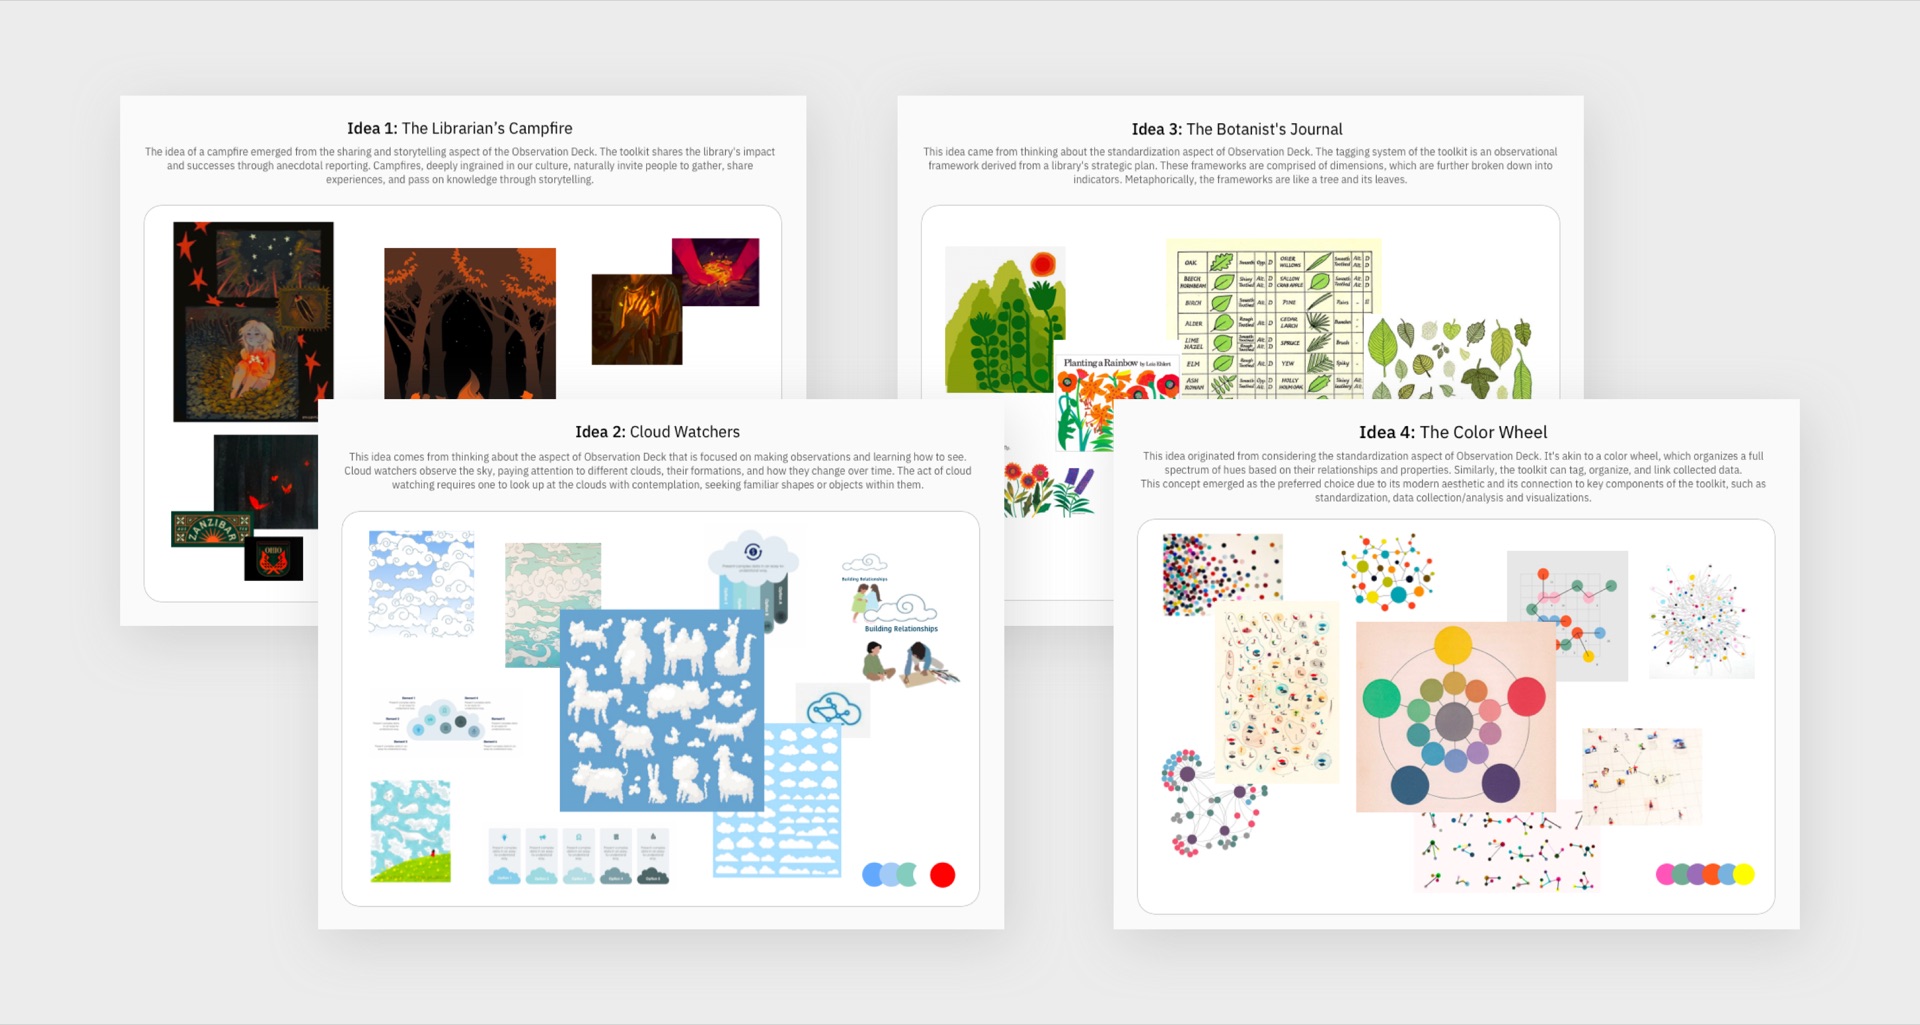
To begin defining the visual look and feel, we turned to creating competing thematic concepts coupled with moodboards.
“Color Wheel” emerged as the preferred choice due to its modern aesthetic, its connection to components of the toolkit such as systemization and its ability to yield a strong art direction.
Designing the Logo
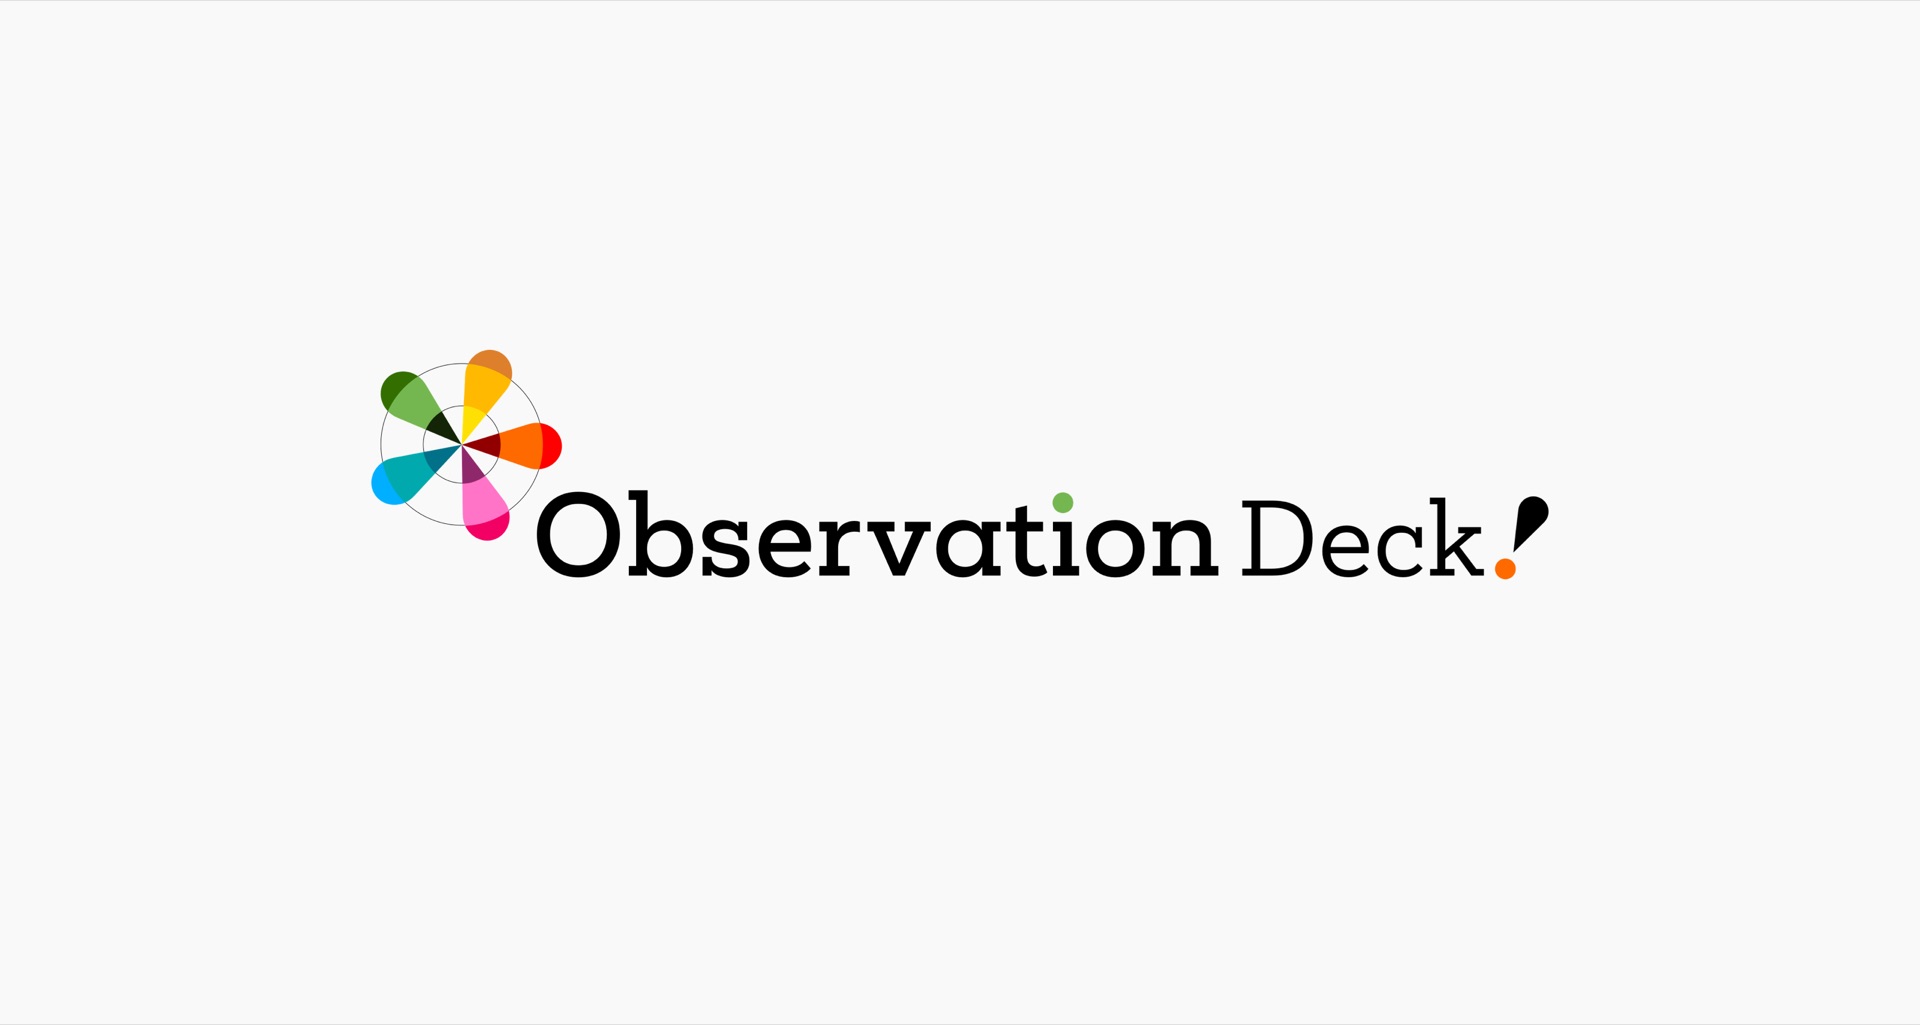
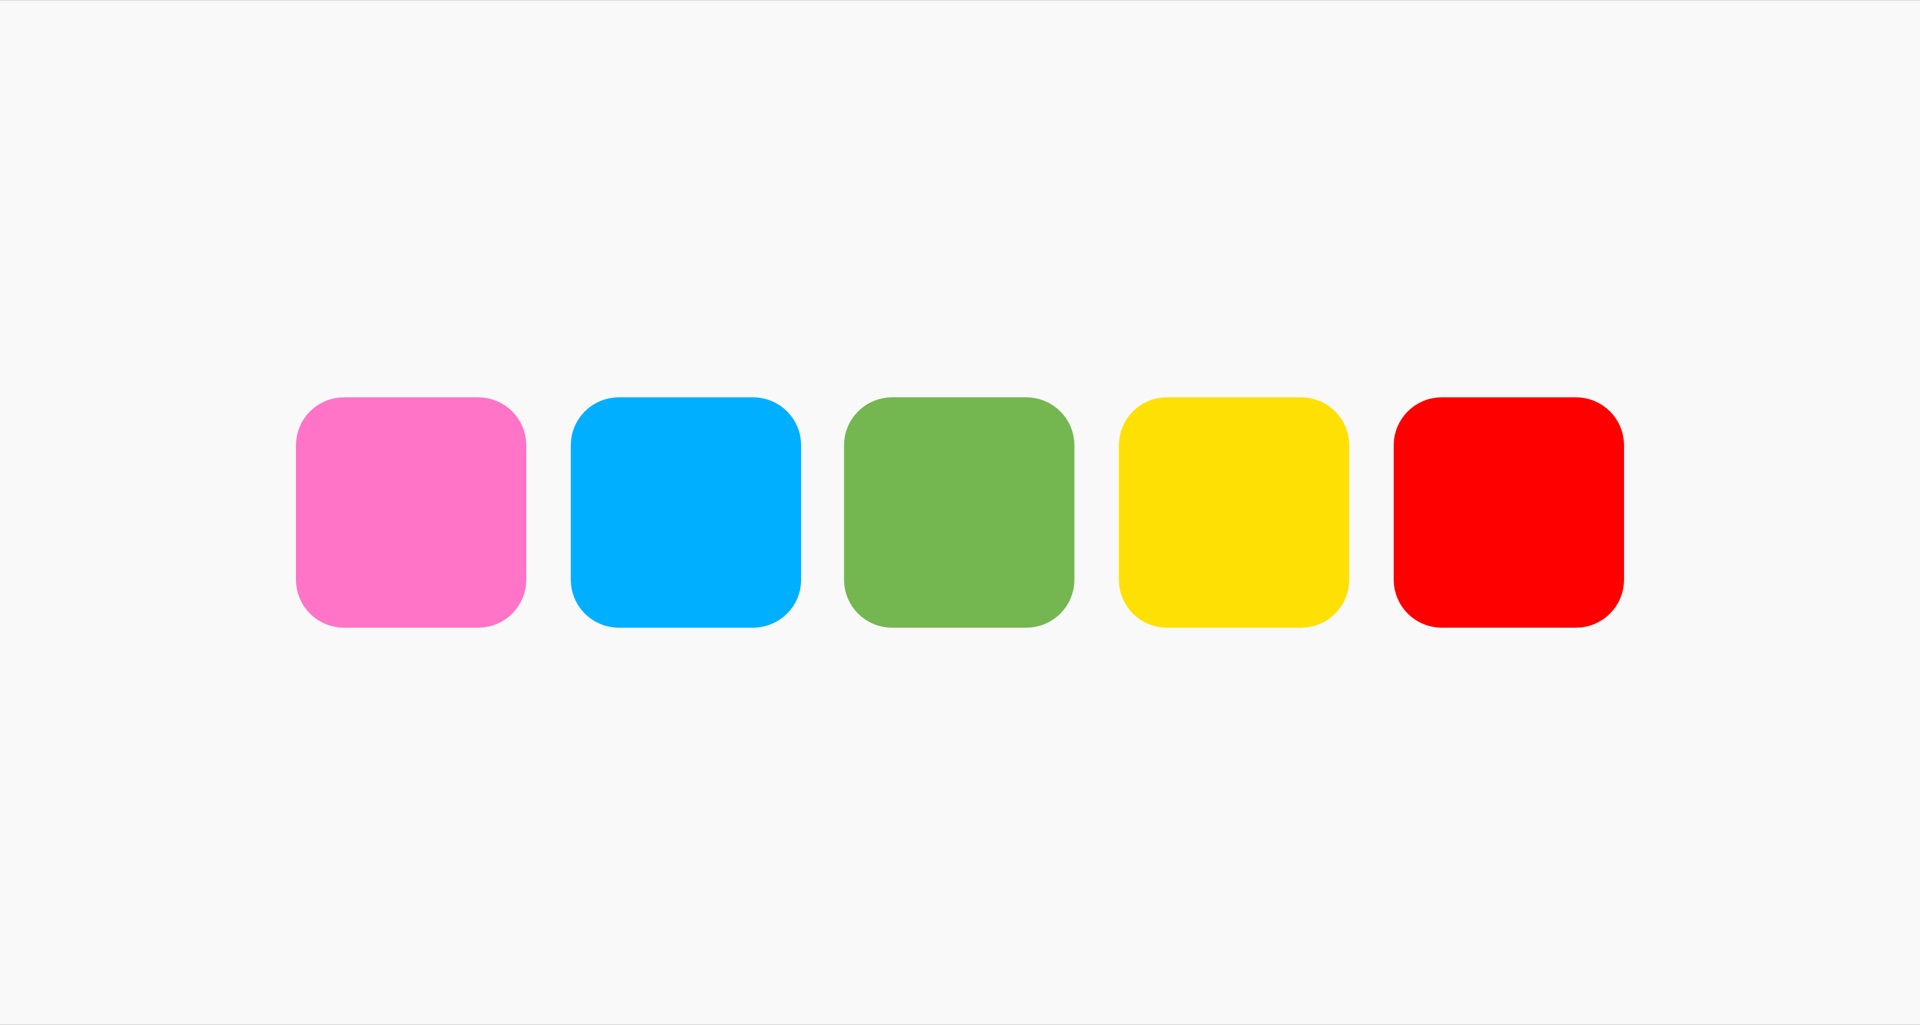
Observation Deck, akin to a color wheel, functions as a sophisticated system for categorizing data. It systematically stores and organizes collected information. The colored dots within the wordmark subtly acknowledge the importance of tagging, while the playful exclamation point infuses a sense of playfulness, contributing to the inviting nature of the brand, complemented by a vibrant color palette.
Website Design
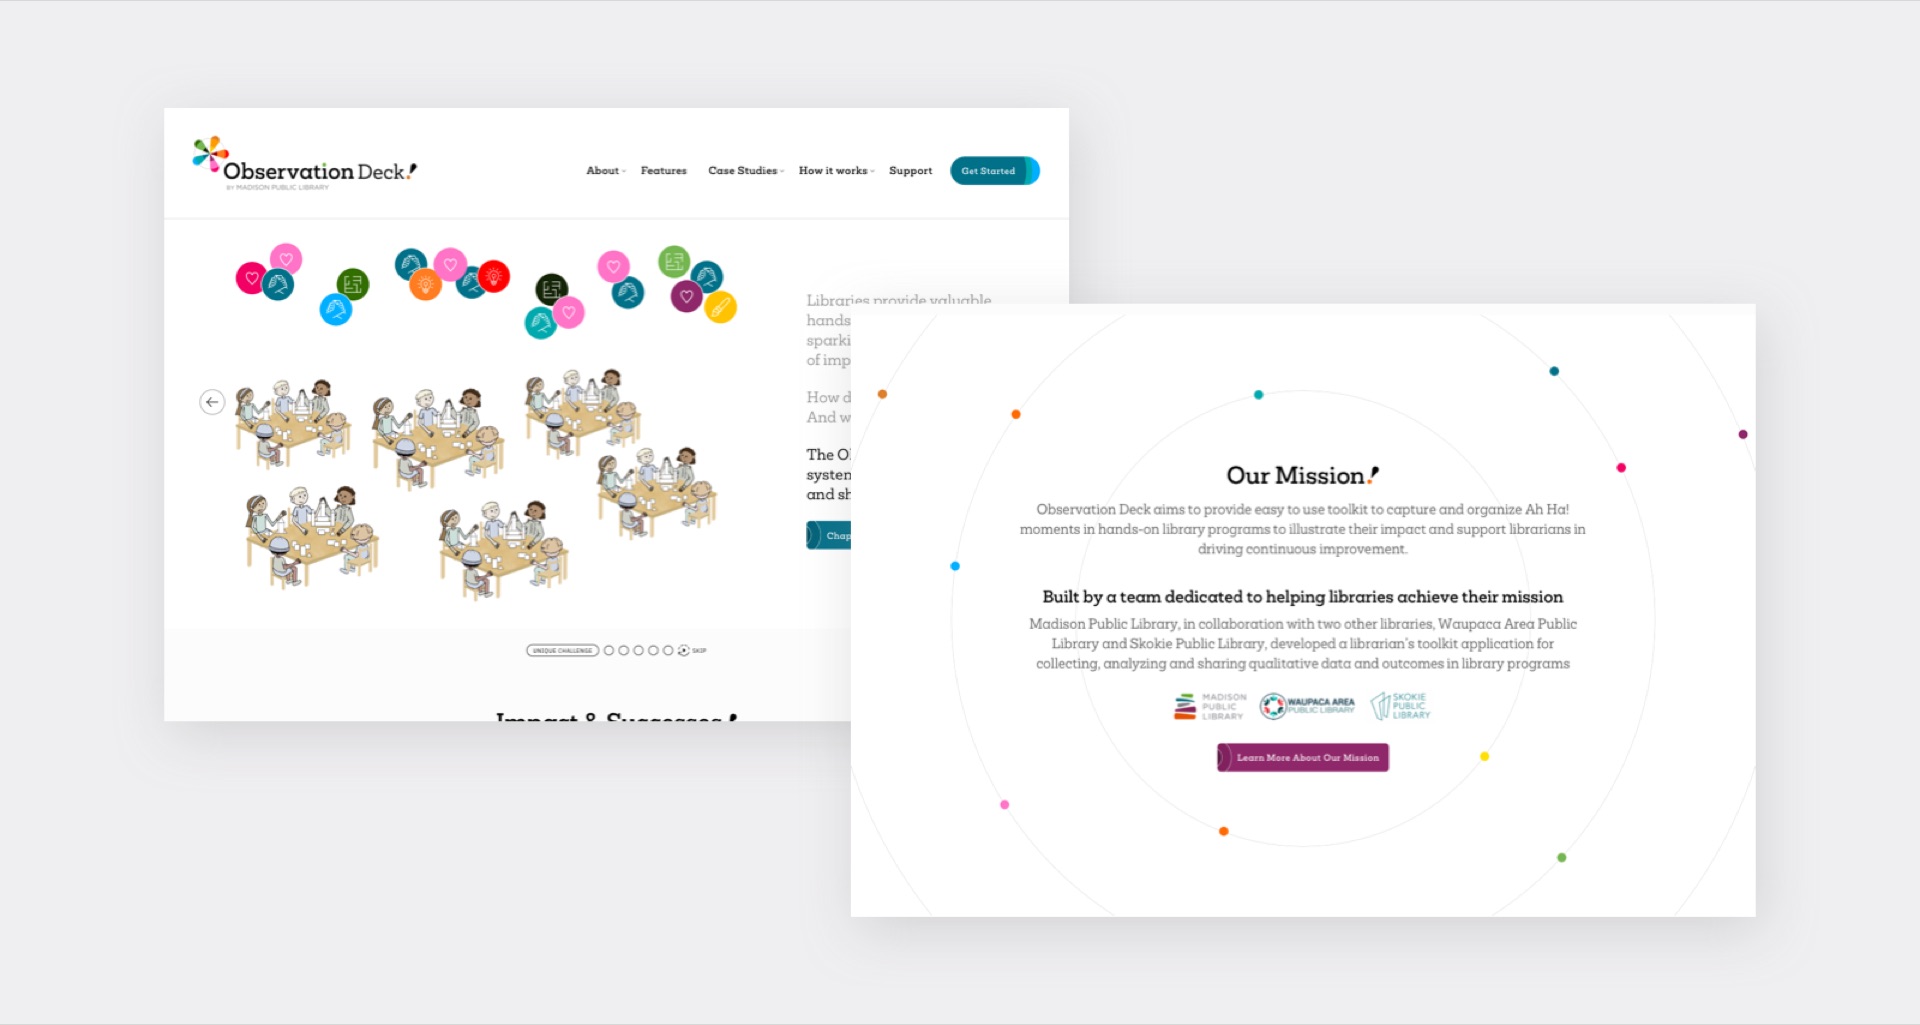
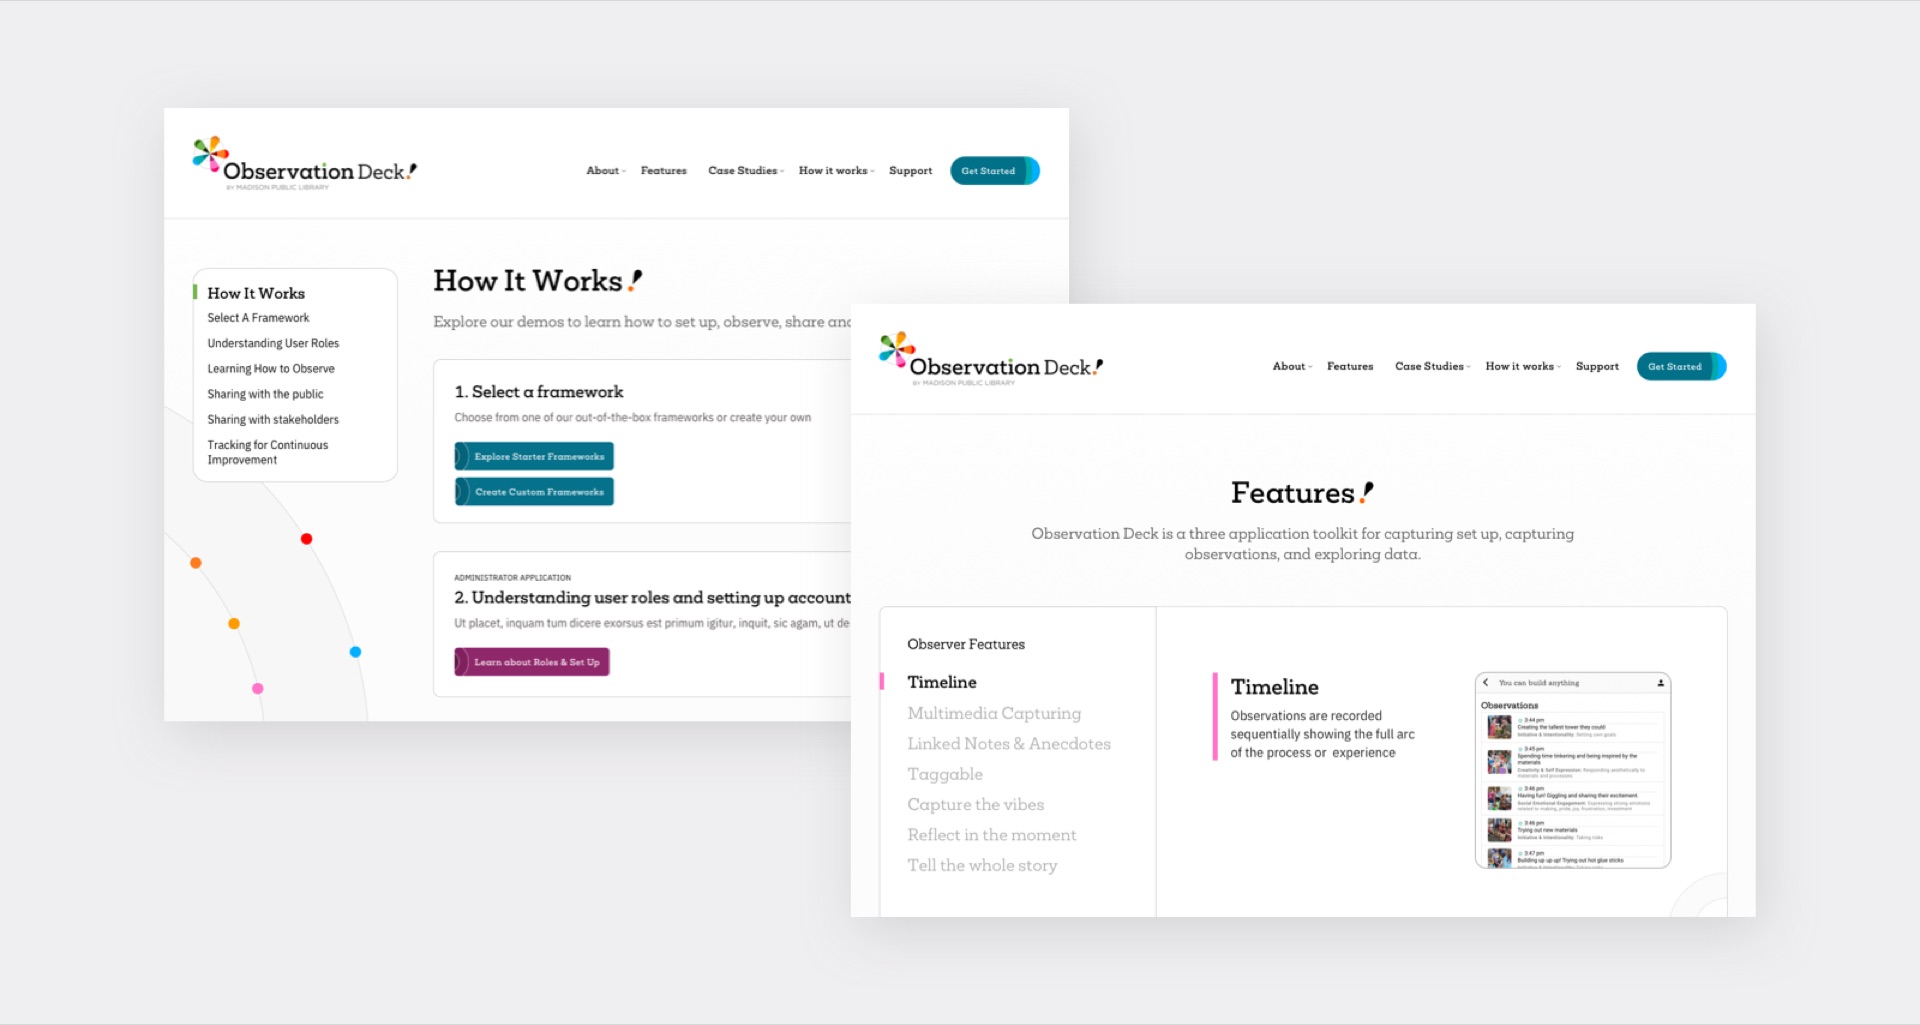
When people first land on the website, they are greeted by a captivating multi-slider animated illustration that introduces visitors to the capabilities of the Observation Deck toolkit. Employing a storyboard-driven approach, a dynamic narrative unfolds across six chapters, each spotlighting a pivotal aspect of the platform:
Campaign Design
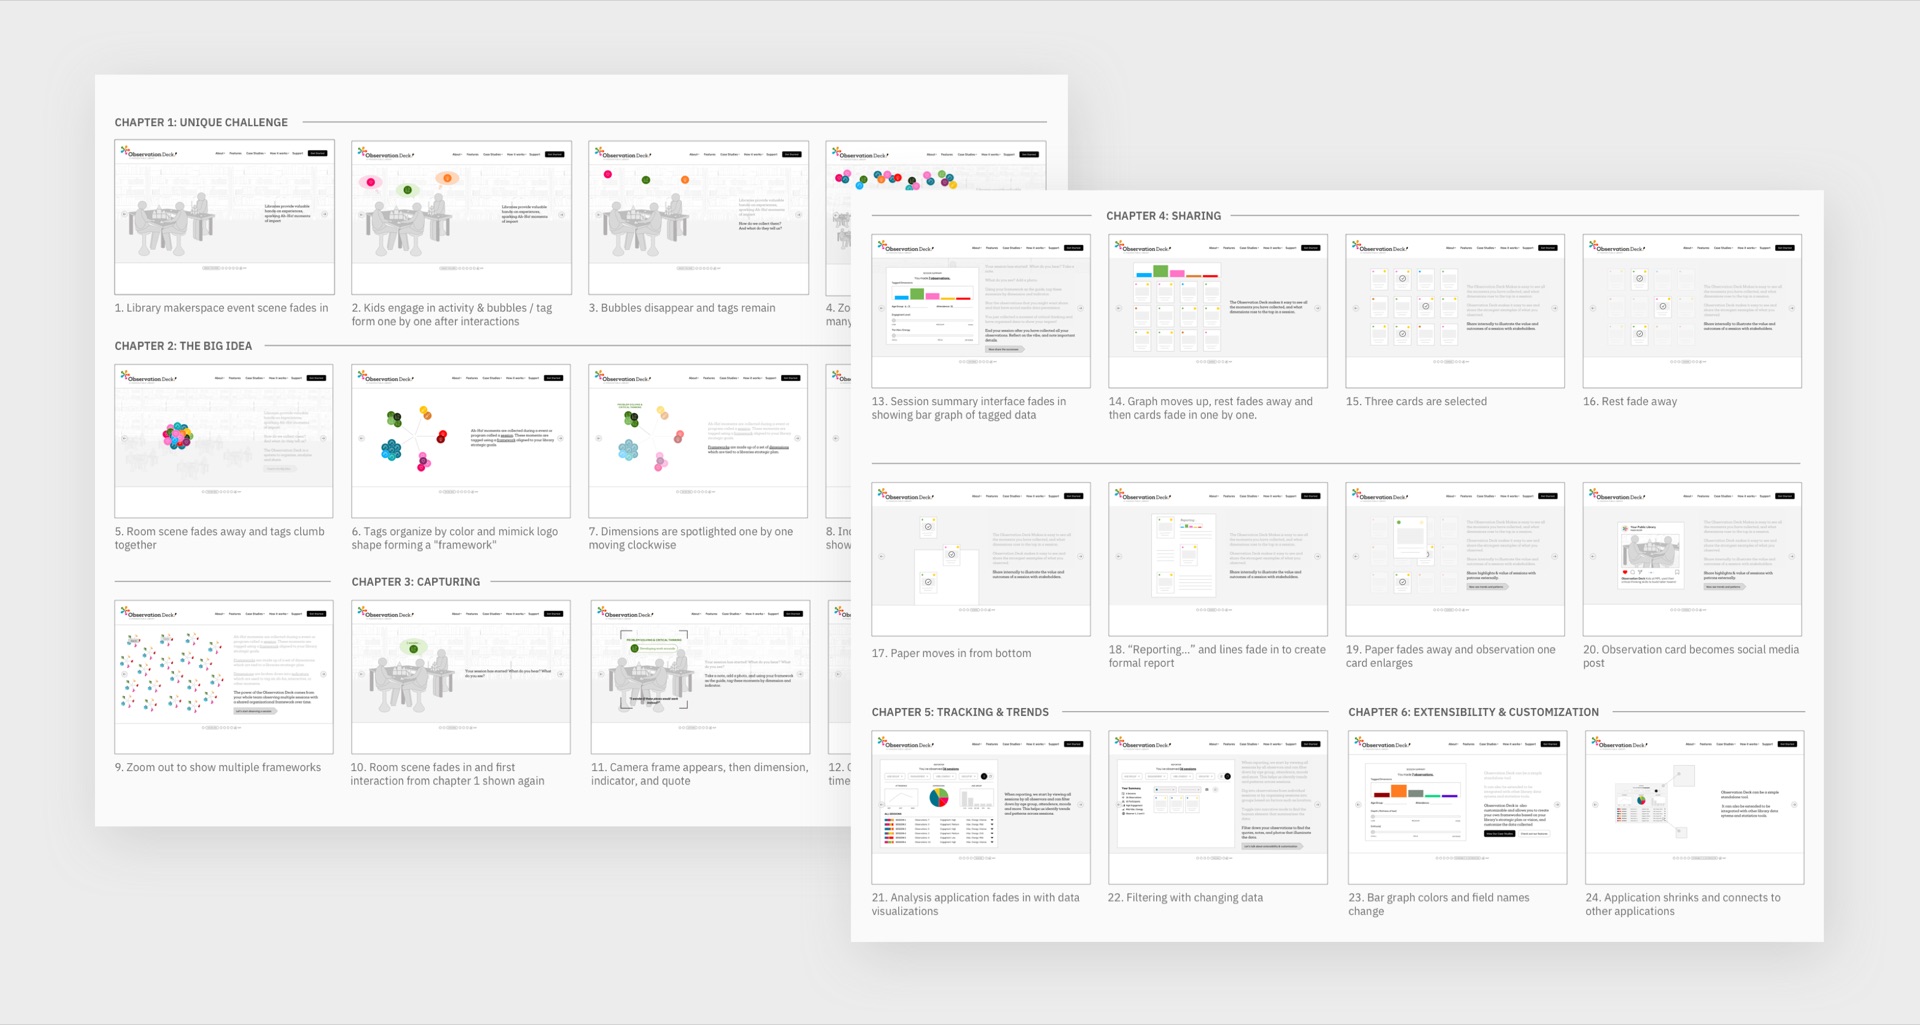
When people first land on the website, they are greeted by a captivating multi-slider animated illustration that introduces visitors to the capabilities of the Observation Deck toolkit. Employing a storyboard-driven approach, a dynamic narrative unfolds across six chapters, each spotlighting a pivotal aspect of the platform:
Chapter 1 (Unique Challenge)
Kicks off by shedding light on the prevailing challenges and gaps inherent in assessment methods within library settings. This sets the stage for the innovative solution offered by Observation Deck, addressing these shortcomings head-on.
Chapter 2: (Big Idea)
Building upon the foundation laid in the first chapter, the storyline delves into the core concepts that underpin the Observation Deck toolkit. This segment elucidates the overarching vision and objectives driving the development of the platform.
Chapters 3,4,5,6
Delve into the functional aspects of the toolkit, each providing insights into its key features: capturing, sharing, tracking, extensibility & customization.
Scrolling Site Animations
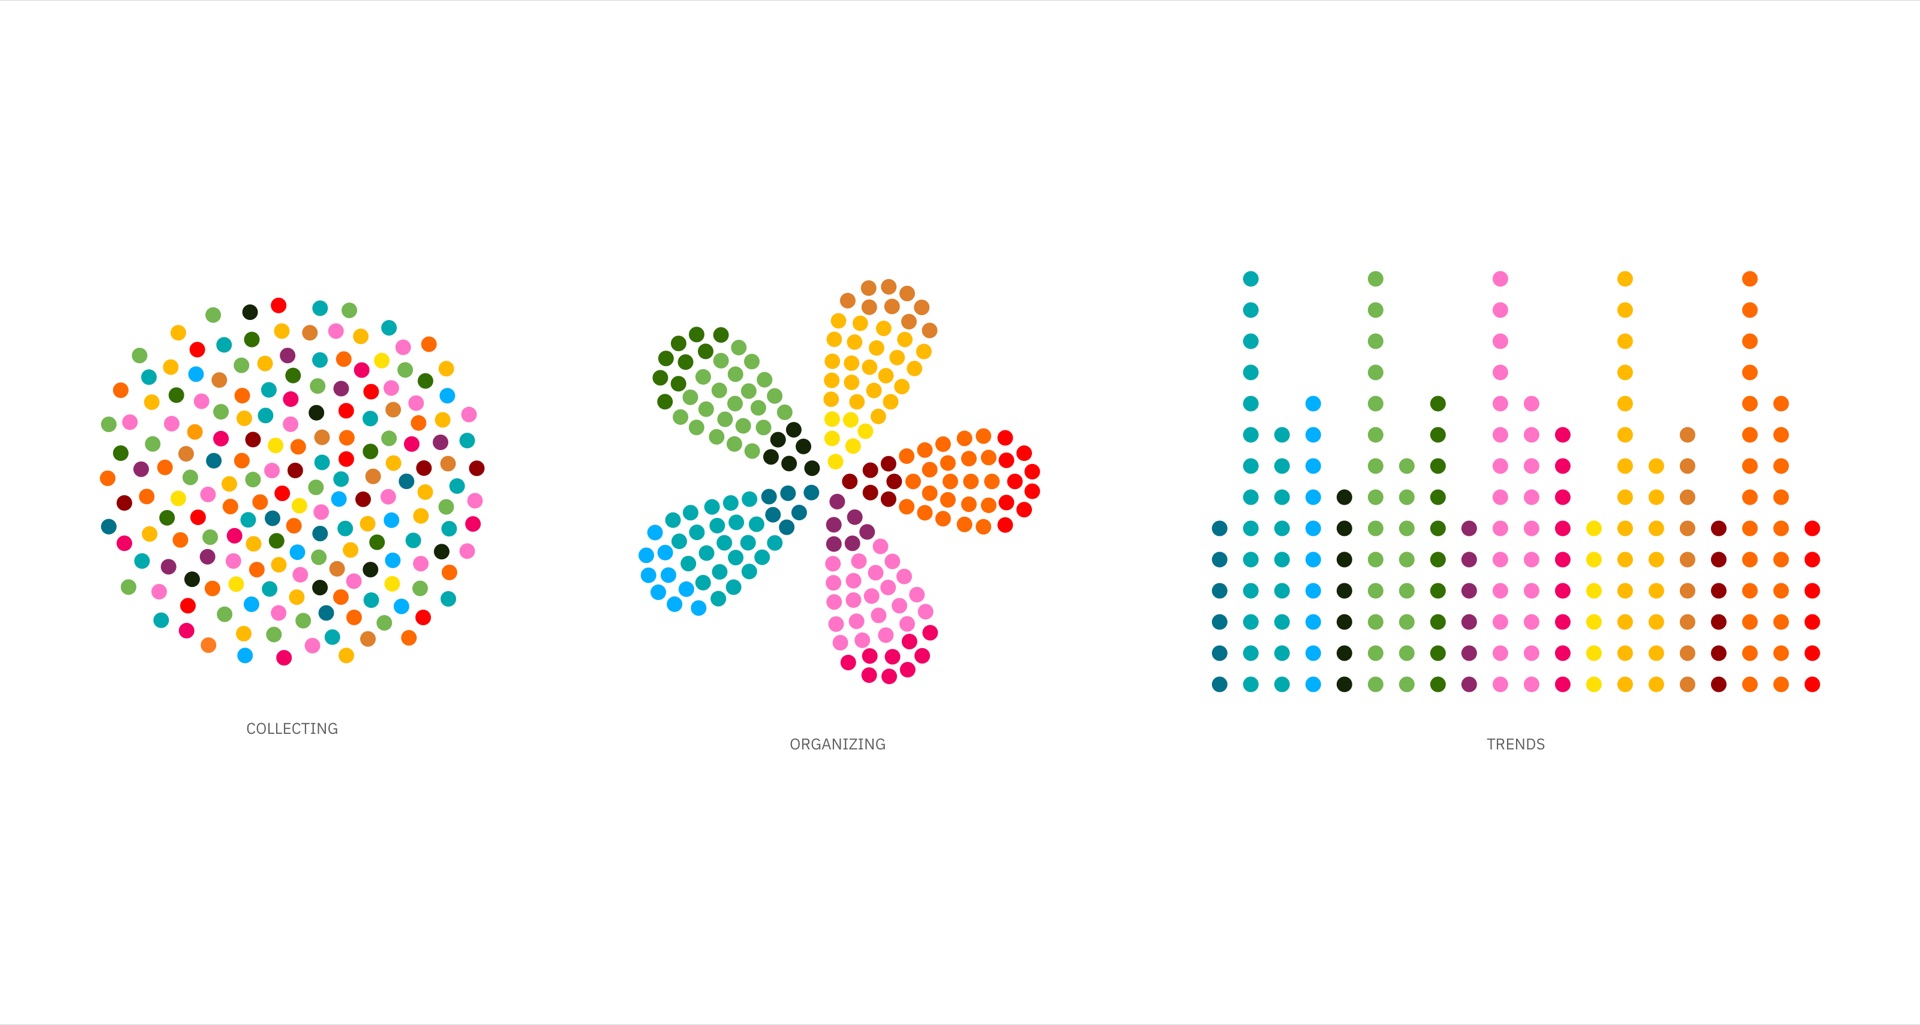
The website also includes scrolling animations illustrating the core functions of the tool:
First Vignette (Observing / Collecting / Gathering):
Dots cluster together to illustrate act of collecting
Second Vignette (Organizing / Grouping)
Colored dots arrange to transform into logo to illustrate organizing
Third Vignette (Trends & Patterns)
Color dots rearrange to transform into graph organized by color to data-driven insights
Designed while at Byte Studios
Sonal Jain - Designer
Michael Diedrick - Site Architect & Content Strategy
Jozi Schneider, Travis Horstmeier, Ryan Golner - Developers
Get in touch
sonaljain.studio@gmail.com